Answered step by step
Verified Expert Solution
Question
1 Approved Answer
having a problem figuring out how to het answers in red cells. i dont know which items to pick to calculate Also u sure if
having a problem figuring out how to het answers in red cells. i dont know which items to pick to calculateAlso u sure if answers are right in the two blue boxes 
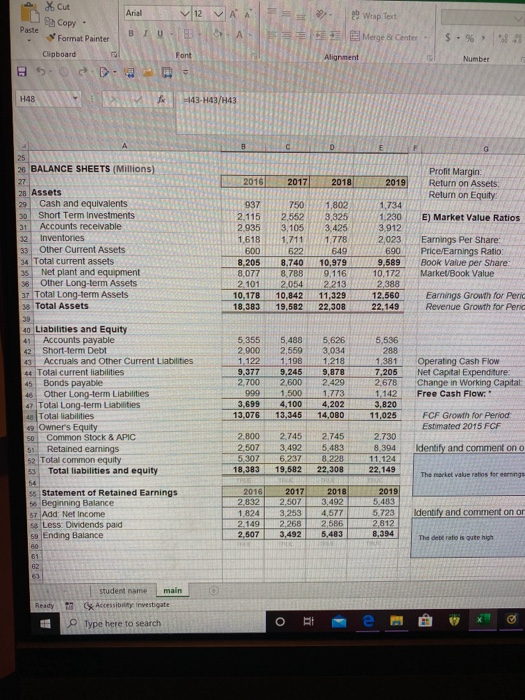
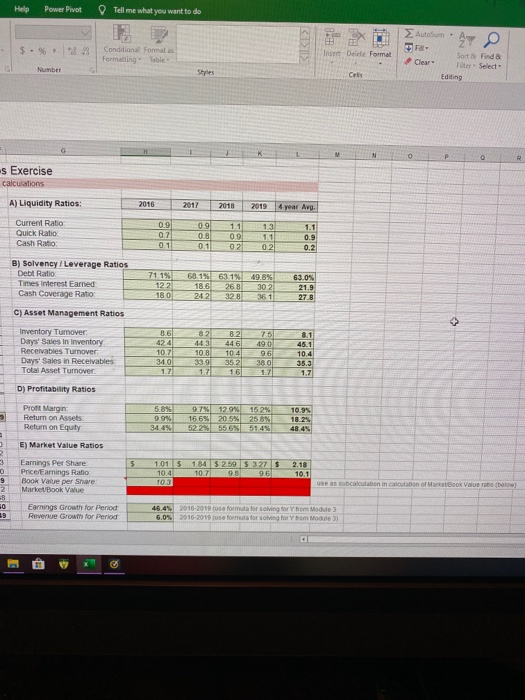
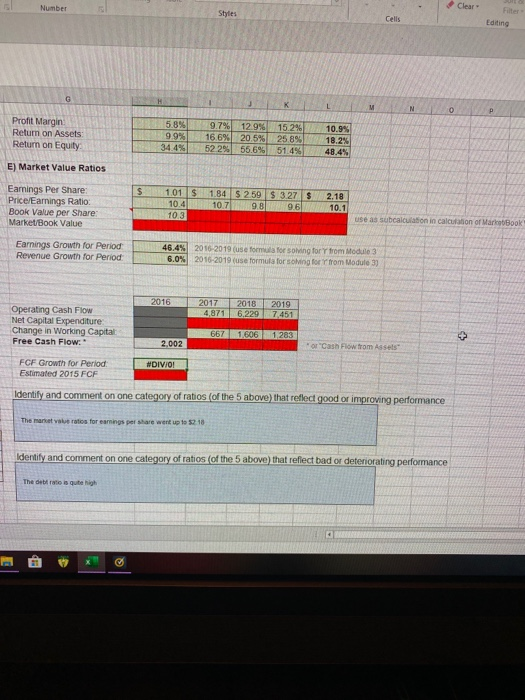
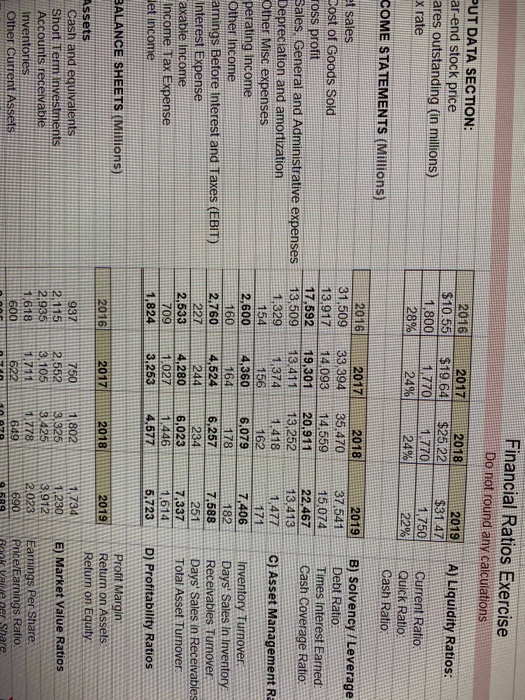
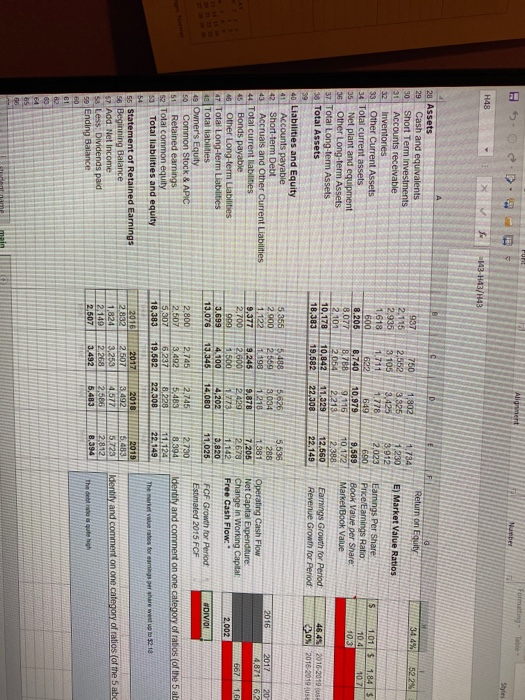
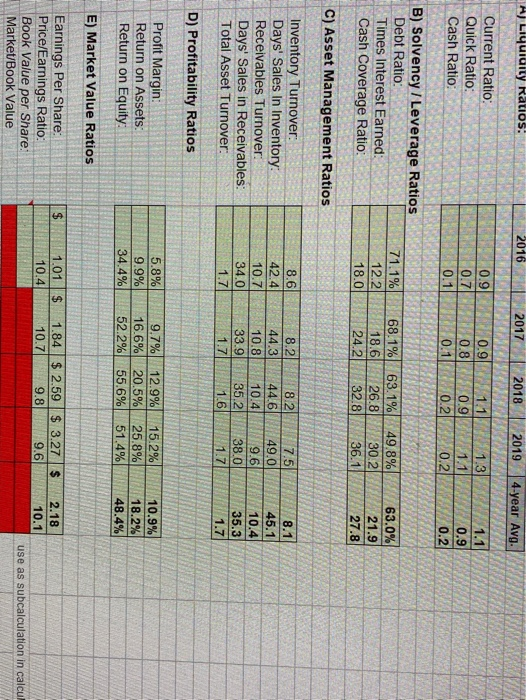
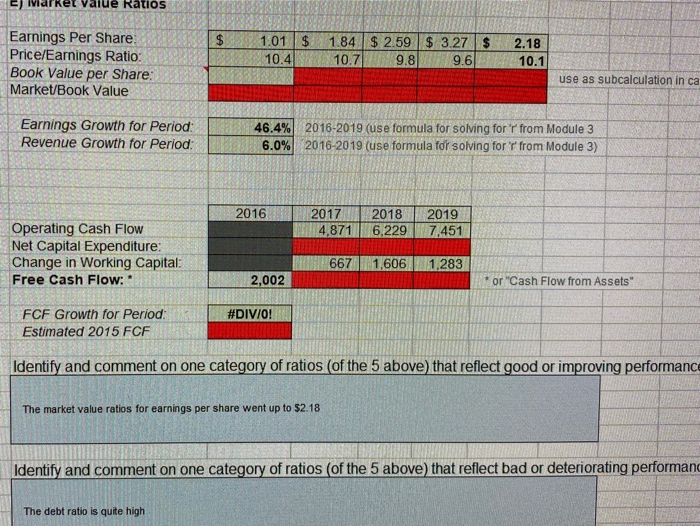 i need to figure out how to find the estimated FCf for 2015 LN Financial Ratios Exercise Do not round my calcu 2019 A) Liquidity Ratios: 2017 2018 2019 year Avg. NPUT DATA SECTION: Year-end stock price Shares outstanding in millions) La rate 2016 $10.66 1.800 289 2017 $19.64 1.270L 249 2018 $25 22 ZO 249 225 Current Rabo Qukk Ratio Cash Ratio: 0.8 0.9 1.1 INCOME STATEMENTS (Millions) 7119 63.05 B) Solvency/Leverage Ratios Debt Ratio Times Interest Earned Cash Coverage Ratio 26. 30.21 21.9 C) Asset Management Ratios et sales Cost of Goods Sold Go profit Sales General and Administrative expenses 16 Depreciation and amortization Other Mic expenses * Operating come Other Income 20 Eng Before Interest and Taxes (EBIT) 2 lnterest Expense 22 Taxable income 23 Income Tax Expense 26 Net income MUL 2013 2012 31.509 33,394135.4701 374541 139171140140815974 17.692 19,30120,911 2 2 467 13.500 13.411 13.252 .13.413 1329 1 374 1,418 1.427 154 156 162 1711 2.6004 ,360 5. 7.406 164 ,178 182 2.7604 ,624 6.257 7.588 227244234 251 2.533 4 2006.023 1,0271446 1.824 4.677 5.723 8. 60 10 Inventory Turnover D ays Sales in Inventory Receivables Tumover OwiS Receivables Total Asset Turnover 7.337 709 3.253 D) Profitability Ratios BALANCE SHEETS (Millions) 2016 2017 2018 Prod Marg Return on Assets Return on Equity 9.73129961524 9.9216. 62075 18.2% 34 4 .522% 556% 51.492.48.4 E) Market Value Ratios 3,912 2,000 Assets 29 Cash and equins Shote investments 31 Accounts recevable 32 WMO 23 Other Current Assets 34 Total current assets 35. Net plant and equipment 36 Chor Lover Assets TOLM Long term Assets & Total Assets 2 .10 10.1 0151845.259A 104 107989 . 6 9371 .002 2,1162.5523,325 2.935 ,1063.42 1.618 1,711 1.778 600622540 8,205 8.740 10.929 8.077 3.7889 ,116 2,101 .0542 213 10,178 10,842 11,329 18.28310.56222,300 Earnings Per Share! Price Earnings Rato Book Value per Share: MarketBook Value 10.172 2.388 12.560 22.149 for sing or module Earnings Growth for Period Revenue Crowth for Period student Ready gate Type X ote to search Return on Equity ) Market Value Ratios Cash and equivalents Short Term investments 31 Accounts receivable 32 inventores Other Current Assets 34 Total current assets Ne plant and equipment Omer long-term Assets T ai Long term Assets 38 Total Assets 1,734 1.230 3.912 2,023 690 9.500 10,172 2.115 2.552 3.325 2.935 3.105 3.425 1,618 1711 1,778 00092649 8.740 10,979 8.7 8.7880 116 2.101 2054 2213 19,176 19.842 11.329 18.303 19.50222.300 S Earnings Per Share Powings Ratio Book Vale per Share: Market Book Value 101154 $250 5 3 27. 2.18 1941079610.1 Caming out for Period Revenge Grown for Pood 46.49 2016-2019 6042016-2019 song from 5.53 es 5,356 5,450 5.626 2.900 2,000 3,034 1112211981 218 9,377 9.245 9.678 2.700 2.600 2420 2016 2010 4871...299 2009 7,451 - Liabilities and Equity 41 Accounts payable Short-term Debt 5 Accrua and Omer Current L Totalcentes * Bonds payable Other Long term Liabilities Total Long-term Liabilities Toes Owner's Equity 0 Common Stock & APIC I R14 l t r TO Common equity Totallaties and equity Operating Cash Flow et Capital Expenditure Change in Woring Capital Free Cash Flow" 2.002 3.699 13.076 4.100 4202 13.34514,080 FCF Grow for And mated 2015 FC 2000 2.745 2,745 and comment on one of abos e above that is good n d pericum Remings kentind c o nnec t ion the above that red bad er detecting performance Type to search O tex X Cut Copy 2 Wrap Text Merge & Center - $ % 58.98 Paste Format Painter Clipboard 5.0 D Number Arial ~12 V A = = BIU. As Font -D 4 3-843/143 Alignment H48 BC RSS 333333322 Financial Ratios Exercise Do not round any calculations A) Liquidity Ratios: 5 INPUT DATA SECTION 8 Year-end stock price 7 Shares outstanding (in millions) 8 Tax rate 2016 $10.56 1.800 28% 3 2017 $19.64 1.770 24% 2018 $25 22 1.770 24% 2019 $31.47 1.750 22% Current Ratio Quick Ratio. Cash Ratio: 10 INCOME STATEMENTS (Millions) B) Solvency / Leverage 2019 3 7,541 15 074 22,467 13,413 1,477 171 Times Interest Earned Cash Coverage Ratio C) Asset Management R 12 Net sales 13 Cost of Goods Sold 14 Gross profit 15 Sales, General and Administrative expenses 16 Depreciation and amortization 17 Other Misc expenses 18 Operating Income 19 Other Income 20 Earnings Before Interest and Taxes (EBIT) 21 Interest Expense 22 Taxable income 23 Income Tax Expense 24 Net income 2016 2017 2018 31,509 33,394 35,470 13,917 14.093 14.559 17,592 19,30120.911 13,509 13,411113,252 1.329 1.374 1.418 154 156 162 2,600 4,360 160 1 64 178 2.760 4,624 6,257 227244234 2,533 4.2806 .023 7091,0271.446 1.8243 ,253 4,577 5,079 7 182 .588 251 7,337 Inventory Turnover Days' Sales In Inventory Receivables Turnover Days Sales in Receivable Total Assel Turnover 5,723 D) Profitability Ratios 28 BALANCE SHEETS (Millions) 2016 2017 2018 2019 Profit Margin: Return on Assets Return on Equity 1.734 1230 3.912 E) Market Value Ratios 2023 2 Assets 29 Cash and equivalents 30 Short Term investments 311 Accounts receivable 32 Inventories 33 Other Current Assets Total current assets 35 Net plant and equipment 38 Other Long-term Assets 37 Total Long-term Assets 39 Total Assets 690 937750 1.802 2.115 2542 3.325 2.935 3.105 3.425 1.618 1,711 1,778 600622649 8,205 8,740 10.979 8,077 8 ,788 9.116 2,101 2,054 2213 10,178 10,842 11,329 18,383 19,582 22.308 Earnings Per Share: Price/Earnings Ratio Book Value per Share MarketBook Value 9.589 10, 172 2 .38.8 1 2,560 22.149 Earnings Growth for Period Revenue Growth for Period Ready to student name main Accesibility Investigate Type here to search 12 VAN Da Copy 25 Wrap Text S EE Merge Center S. 9 92 X Cut Arial Paste - Format Painter BLU- Clipboard 5. 0D H48 Alignment 26 BALANCE SHEETS (Millions) 2016 2017 2018 28 Assets 29 Cash and equivalents 30 Short Term Investments 31 Accounts receivable 32 Inventories 33 Other Current Assets 34 Total current assets 35 Net plant and equipment 38 Other Long-term Assets 37 Total Long-term Assets 38 Total Assets 937 7 50 1.802 2.11525523,325 2.935 3.105 3.425 1.6181.711 1.778 600 622 649 8.205 8.740 10.979 8.0778 .788 9.116 2.1012.0542.213 10,178 10,842 11,329 18.383 19.58222.308 Profit Margin: 2019 Return on Assets Return on Equity 1,734 1,230E ) Market Value Ratios 3.912 2023 Earnings Per Share: 690 Price/Earnings Ratio: 9,589 Book Value per Share 10.172 MarketBook Value 2,388 12.560 Earnings Growth for Peric 22.149 Revenue Growth for Peric 5,3555,488 5,6265 ,536 2.000 2.559 3.034 28.8 1.1221 .1981 .2181.381 9.3779 ,2459 ,8787.205 2700 2.600 2.429 2.678 999 1.500 1.773 1.142 3,6994,100 4,2023 .820 13.076 13.345 14,080 11,025 Operating Cash Flow Net Capital Expenditure Change in Working Capital Free Cash Flow." FCF Growth for Period Estimated 2015 FCF 40 Liabilities and Equity 41 Accounts payable 42 Short-term Debt 43 Accruals and Other Current Liabilities 44 Total current liabilities 45 Bonds payable 45 Other Long-term Liabilities 47 Total Long-term Liabilities 4 Total liabilities 49 Owner's Equity 50 Common Stock & APIC 51 Retained earnings 52. Total common equity 53 Total liabilities and equity 54 55 Statement of Retained Earnings 56 Beginning Balance 57 Add: Net Income 5 Less: Dividends paid 59 Ending Balance Identify and comment on o The market value ratios for earnings 2.800 2.745 2.745 2,730 2.5073.4925.4838 .394 5.3076.2378.228 11.124 18.383 19,582 22.308 22.149 PE 1 RETRO 2016 2017 2018 2019 2.507 3.492 5 .483 1,824 3.253 4,577 5 .723 2.149 2.26826862.812 2.507 3.4925,4838 ,394 Identify and comment on or The debe ratio is gute high Ready to student name main Accessibility investigate Type here to search Help Power Pivot Tell me what you want to do EXP Autosom O $ - 1.02 Conditional Formatas Formatting Table SIS Delete Format Clear Sort & Fonda Filter Select- Editing s Exercise culations A) Liquidity Ratios: 2017 2019 4 year Avg. Current Ratio Quick Ratio Cash Ratio 0.9 07 01 0.9 08 01 1.1 09 02 13 1. 1 0.2 0 .9 0.2 B) Solvency / Leverage Ratios Debt Ratio Times Interest Earned Cash Coverage Ratio 71.1% 12 21 68.15 498% 63.15 268 328 303 63.0% 21.9 180 242 27.8 C) Asset Management Ratios Inventory Turnover Days' Sales In Inventory Receivables Turnover Days Sales in Receivables Total Asset Turnover 8.2 446 10.41 352 10.8 339 OX D) Profitability Ratios Proft Margin: Return on Assets Return on Equity 5.8% 99% 97% 166% 12 9% 20.5% 15 296 258% 10.9% 18.24 E) Market Value Ratios Earnings Per Share Price Earnings Ratio BOOK Value per Share MarketBook Value Earnings Growth for Period Reverse Growth for Period 46,45 2016-2019 fue formula for solving for hom Module 3 al Number Clear Editing MNOP Profit Margin Return on Assets Return on Equity 5.8% 99% 34 4 9.7% 16.6% 352 29 12.9% 20.5% 55.6% 2 15. 1 0.9% 25895 18.2% 51 49 348.4% E) Market Value Ratios 101 $ 1.94 $ 259 5 3 27 $ 2.18 Earnings Per Share: Price/Earnings Ratio: Book Value per Share: Market/Book Value 10.1 use a subcalculation in calculation of Mar Book Earnings Growth for Period Revenue Growth for Period 46.4% 6.0% 2016-2019 (use formula for solving for Y from Module 3 2016-2019 (use formula for s ing for from Module 3) 2016 2017 4.871 2018 6.229 2019 7,451 Operating Cash Flow Net Capital Expenditure: Change in Working Capital Free Cash Flow: 1.606 1.283 FCF Growth for Period: Estimated 2015 FCF #DIV/0! Identity and comment on one category of ratios (of the 5 above) that reflect good or improving performance The market value ratios for earnings per share went up to 52.18 Identity and comment on one category of ratios (of the 5 above) that reflect bad or deteriorating performance The debt ratio is quite high Financial Ratios Exercise Do not round any calculations PUT DATA SECTION: ar-end stock price ares outstanding (in millions) x rate A) Liquidity Ratios: 2016 $10.55 1,800 28% 2017 $19.64 1.770 24% 2018 $25.22 1.770 24% 2019 $31 47 1,750 22% Current Ratio Quick Ratio Cash Ratio COME STATEMENTS (Millions) 2019 37 541 15 074 22,467 13.413 1,477 B) Solvency / Leverage Debt Ratio Times Interest Earned: Cash Coverage Ratio: 13,252 11374 C) Asset Management Ra et sales Cost of Goods Sold ross profit Sales General and Administrative expenses Depreciation and amortization Other Misc expenses perating Income Other Income arnings Before Interest and Taxes (EBIT) Interest Expense axable income Income Tax Expense let income 2016 2017 2018 31,509 33,394 35.470 13.917 14.093 14.559 17,592 19.301 20,911 13,509 13.411 1,329 1.418 154 156 2,600 4,360 6.079 160 2,7604,524 6,257 227 2 44 234.. 2,533 4,2806,023 7091.0271.446 1,824 3,253 4.577 164 Inventory Turnover. Days' Sales In Inventory Receivables Turnover Days' Sales in Receivables Total Asset Turnover 1.614 5.723 D) Profitability Ratios BALANCE SHEETS (Millions) 2016 2017 2018 Profit Margin 2019 A1 Return on Assets M Return on Equity 1.734 1.230 E) Market Value Ratios Assets Cash and equivalents Short Term Investments Accounts receivable Inventories Other Current Assets NO 3,912 PEN 2.0231Earnings Per Share 690 Price/Earnings Ratio: 9589 Anak Valve ner Share BSO - B H48 143-H43/1943 5229 1 28 Assets 29 Cash and equivalents 30 Short Term Investments 31 Accounts receivable 32 Inventories 33 Other Current Assets 34 Total current assets 35 Net plant and equipment 36 Other Long-term Assets 37 Total Long-term Assets Total Assets Return on Equity 937 1.750 1,802 1,734 2.115 2,552 3325 1230E) Market Value Ratios 2,9353,105 13.425 3.912 1,618 1.778 112,023 Earnings Per Share 1600 649 1 600 Price/Earnings Ratio 8,206 18,740 10.979 9,589 Book Vaue per Share 8.077 1 8.788 / 9.116 10.172 Market Book Value 2.10111112054122132388 10,178 10,842 11,3291 12,560 Earnings Growth for Period 18,383 119,582 122.308 22.149 Revenue Growth for Period 622 1.01 $ 1.843 104 10.7 46.45 +0% 2016-2019 2016-2019 USE NO 2016 5355 2.900 1.122 9,377 2,700 2017 4,871 20- 6,2 119.245 2.600 40 Liabilities and Equity 41 Accounts payable 42 Short-term Debt 43 Accruals and Other Current Liabilities 44 Total current liabilities 45 Bonds payable 46 Other Long-term Liabilities 47 Total Long-term Liabilities 48 Total liabilities 49 Owner's Equity 50 Common Stock & APIC 51 Retained earnings 52 Total common equity 53 Total liabilities and equity 5,536 288 1218 1.381 9,878 7,205 2.678 1.773 1 142 4.2022,820 14,060 1 11.025 Operating Cash Flow Net Capital Expenditure: Change in Working Capital Free Cash Flow: 2. 1999 3.699 13,076 4.100 13.345 FCF Growth for Period Estimated 2015 FCF 2,800 2.745 2.745 2.5073 ,492115.483 5,30711152370.220 18.383119.582111 22.3081 2730 8.394 1.124 22.149 Identify and comment on one category of rabios (of the 5 ab The market value rates for a she went up to $2.18 55 Statement of Retained Earnings 56 Beginning Balance 57 Add: Net Income 58 Less Dividends paid 59 Ending Balance 2016 2017 2,832 112.50 13.29 2.14912 268 12.507 3.492 1.824 2018 3.492 457 5 2.5862 6,483 2019 5.4031 .23 812 8.394 konbity and comment on one category of ralios of the 5 abc 888 A Liquidity Ralios! 2016 2017 2018 2019 4-year Avg. 1.1 Current Ratio: Quick Ratio: Cash Ratio 0. 9 0.7 0.1 0.9 0.8 0.1 1. 11 .3 0.9 1.1 0.2 0.2 0.9 0.2 B) Solvency / Leverage Ratios Debt Ratio: Times Interest Earned: Cash Coverage Ratio: |_71.1% 12.2 18. 0 68,1% 63.1% 18.6 26. 8 24. 2 32.8 49.8%E 302 36.1 63.0% 21.9 C) Asset Management Ratios 8.6 Inventory Turnover: Days' Sales In Inventory Receivables Turnover: Days' Sales in Receivables: Total Asset Turnover: 42.4 10.7 28. 27.5 344. 649. 0 10. 49 . 6 35. 2 38.0 1.6 1.71 8.1 45.1 10.4 35.3 1.7 D) Profitability Ratios Profit margin: Return on Assets: Return on Equity 5.8% 9.9% 34.4% 9.7% 16.6% 52.2% 12.9% 20.5% 55.6% 15.2% 25.8% 51.4% 10.9% 18.2% 48.4% E) Market Value Ratios $ Earnings Per Share: Price/Earnings Ratio: Book Value per Share: Market/Book Value 1.01 $ 1.84 $ 2.59 $ 3.27 $ 2.18 10. 410. 79.8W9. 610.1 use as subcalculation in calcul EJ Ivarret Value Ratios $ Earnings Per Share: Price/Earnings Ratio: Book Value per Share: Market/Book Value 1.01 $ 10. 4 1.84 $ 2.59 $ 3.27 1 0.7 9.8 6 9. $ 2.18 1 0.1 use as subcalculation in ca Earnings Growth for Period: Revenue Growth for Period: 23 46.4% 6.0% 2016-2019 (use formula for solving for 'r' from Module 3 2016-2019 (use formula for solving for 'r from Module 3) 2016 2017 2018 4,8716,229 2019 7,451 Operating Cash Flow Net Capital Expenditure: Change in Working Capital Free Cash Flow: * 667 1,606 1,283 2,002 * or "Cash Flow from Assets" FCF Growth for Period: Estimated 2015 FCF Identify and comment on one category of ratios (of the 5 above) that reflect good or improving performance The market value ratios for earnings per share went up to $2.18 Identify and comment on one category of ratios (of the 5 above) that reflect bad or deteriorating performand The debt ratio is quite high
Also u sure if answers are right in the two blue boxes
Step by Step Solution
There are 3 Steps involved in it
Step: 1

Get Instant Access to Expert-Tailored Solutions
See step-by-step solutions with expert insights and AI powered tools for academic success
Step: 2

Step: 3
Ace Your Homework with AI
Get the answers you need in no time with our AI-driven, step-by-step assistance
Get Started