

Answered step by step
Verified Expert Solution
Question
1 Approved Answer
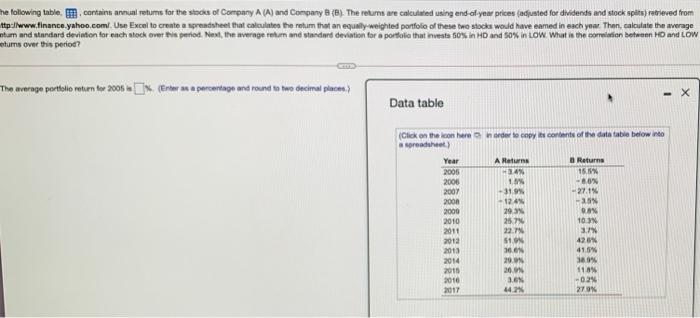
he following table contains annual retums for the stocks of Company A (A) and Company B (B). The retums are calculated using end-ofyear prices (adjusted
Step by Step Solution
There are 3 Steps involved in it
Step: 1

Get Instant Access to Expert-Tailored Solutions
See step-by-step solutions with expert insights and AI powered tools for academic success
Step: 2

Step: 3
Ace Your Homework with AI
Get the answers you need in no time with our AI-driven, step-by-step assistance
Get Started
Cases in Financial Reporting
Authors: Michael J. Sandretto
1st edition
538476796, 978-0538476799