

Question
heats credit d- Split the dataset into testing and training sets with the following parameters: test_size=0.25, random_state=4. e- Use KNN (with k=3), Decision Tree (with
heats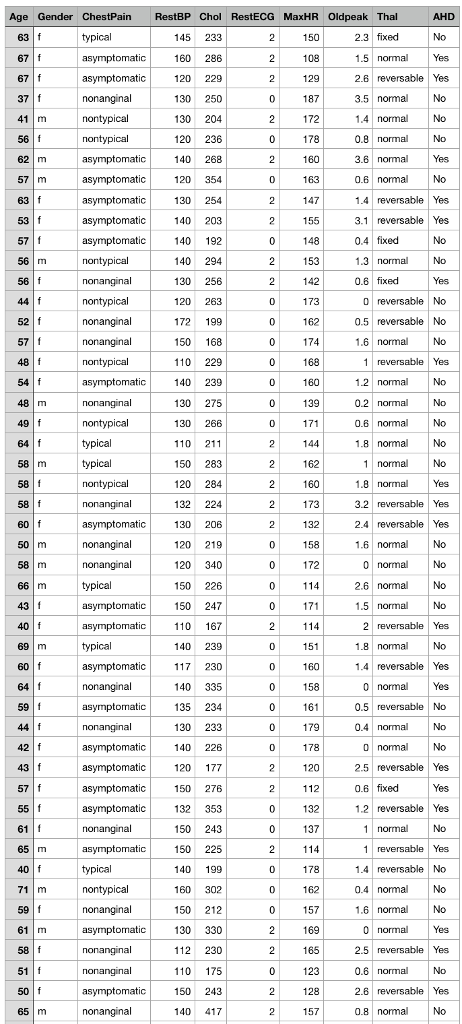 credit
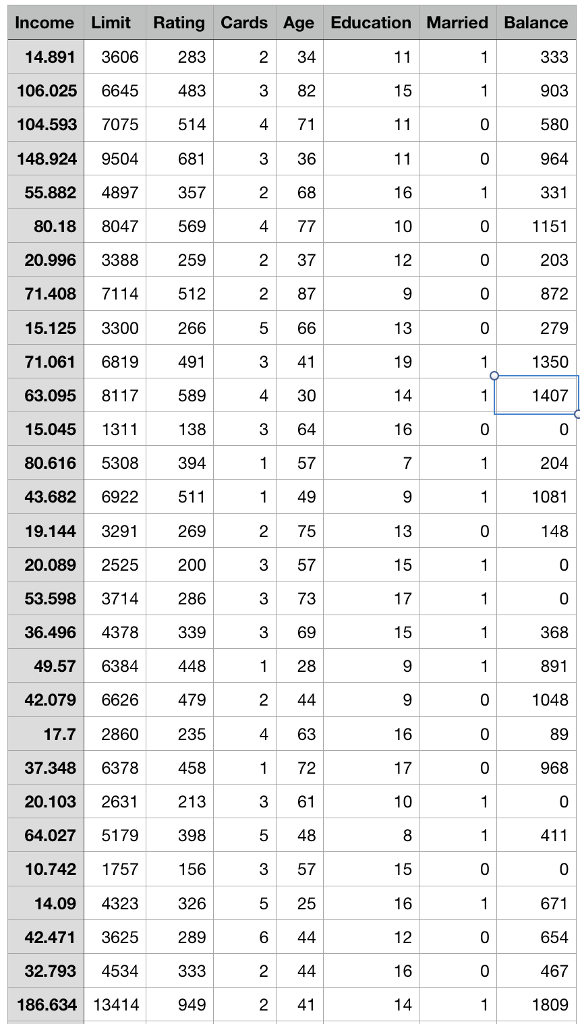
d- Split the dataset into testing and training sets with the following parameters: test_size=0.25, random_state=4.
e- Use KNN (with k=3), Decision Tree (with random_state=5), and Logistic RegressionClassifiers to predict Heart Disease based on the training/testing datasets that you built in part (d). Then check, compare, and report the accuracy of these 3 classifiers. Which one is the best? Which one is the worst?
f- Now, we want to use the categorical features as well! To this end, we have to perform a feature engineering process called OneHotEncoding for the categorical features. To do this, each categorical feature should be replaced with dummy columns in the feature table (one column for each possible value of a categorical feature), and then encode it in a binary manner such that only one of the dummy columns can take 1 at a time (and zero for the rest). For example, Gender can take two values m and f. Thus, we need to replace this feature (in the feature table) by 2 columns titled m and f. Wherever we have a male subject, we can put 1 and 0 in the columns m and f. Wherever
we have a female subject, we can put 0 and 1 in the columns m and f. (Hint: you will need 4 columns to encode ChestPain and 3 columns to encode Thal).
g- Repeat parts (d) and (e) with the new dataset that you built in part (f). How does the prediction accuracy change for each method?
h- Now, repeat part (e) with the new dataset that you built in part (f), but this time usingCross-Validation. Thus, rather than splitting the dataset into testing and training, use 10-fold Cross-Validation (as we learned in Lab4) to evaluate the classification methods and report the final prediction accuracy.
Generate the feature matrix and target vector (target is balance in this dataset). Then,normalize (scale) the features (note: dont normalize the target vector!). To normalize the data, you can simply use preprocessing.scale(X) from sklearn.
d- Split the dataset into testing and training sets with the following parameters: test_size=0.24, random_state=4.
e- Use Linear Regression to train a linear model on the training set. Check the coefficients of the linear regression model. Which feature is the most important? Which feature is the least important?
f- Predict balance for the users in testing set. Then, compare the predicted balance with the actual balance by calculating and reporting the RMSE (as we saw in lab tutorial 4).
g- Now, use 10-fold Cross-Validation to evaluate the performance of a linear regression in predicting the balance. Thus, rather than splitting the dataset into testing and training, use Cross-Validation to evaluate the regression performance. What is the RMSE when you use cross validation?
al al- 5-6 k|3|5|654|8|6 6-414|3|6|056|1| .2 2|681|8|2|4606 5|2|840|5|4|05|62|1|1| .4 0 ca 2 | 2 2 0 2 0 2 0 2 2 0 2 2 0 0 0 0|0|0 0 2 2 2-2 2 0 0 0 0 2-0 0 0 0|0 0 2 2 0 0 2 0 0 0 2 2 0-2 2 ici 2 200 220 250 201 200 200 ss 2 201 92 201 250 ass 199 68 220 200 75 200 011 28 201 24 200 210 34 220 24 16 39 3 5 201 200 220 1 2 ss 125 99 202 12 33 23 17 24 17 0 - ic-ic-ic Age 6677 41 56 6 5 6 53 57 56 56 44 558 54 48 49 64 58 58 58 60 50 58 66 43 40 69 60 64 59 44 42 43 57 55 6 5 40 71 59 61 58 51 50 65 al al- 5-6 k|3|5|654|8|6 6-414|3|6|056|1| .2 2|681|8|2|4606 5|2|840|5|4|05|62|1|1| .4 0 ca 2 | 2 2 0 2 0 2 0 2 2 0 2 2 0 0 0 0|0|0 0 2 2 2-2 2 0 0 0 0 2-0 0 0 0|0 0 2 2 0 0 2 0 0 0 2 2 0-2 2 ici 2 200 220 250 201 200 200 ss 2 201 92 201 250 ass 199 68 220 200 75 200 011 28 201 24 200 210 34 220 24 16 39 3 5 201 200 220 1 2 ss 125 99 202 12 33 23 17 24 17 0 - ic-ic-ic Age 6677 41 56 6 5 6 53 57 56 56 44 558 54 48 49 64 58 58 58 60 50 58 66 43 40 69 60 64 59 44 42 43 57 55 6 5 40 71 59 61 58 51 50 65Step by Step Solution
There are 3 Steps involved in it
Step: 1

Get Instant Access to Expert-Tailored Solutions
See step-by-step solutions with expert insights and AI powered tools for academic success
Step: 2

Step: 3
Ace Your Homework with AI
Get the answers you need in no time with our AI-driven, step-by-step assistance
Get Started
Time Series Databases New Ways To Store And Access Data
Authors: Ted Dunning, Ellen Friedman
1st Edition
1491914726, 978-1491914724