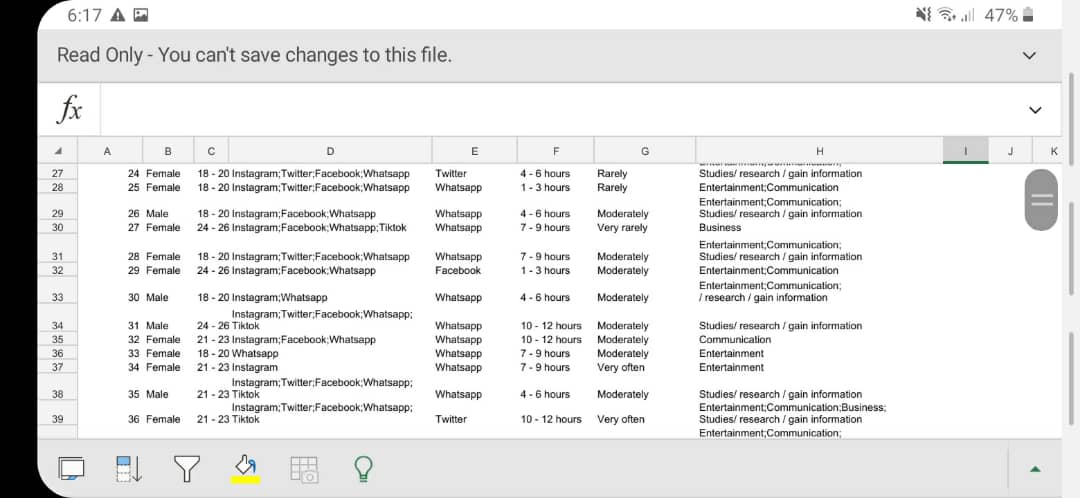
Hello, can anyone please help me with my part of the group assignment for elementary statistics
------
My part is.
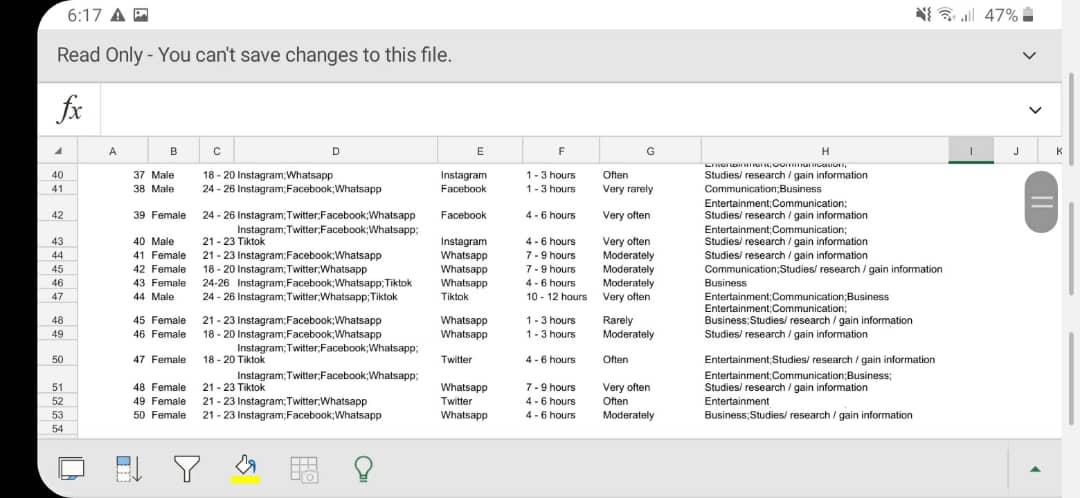
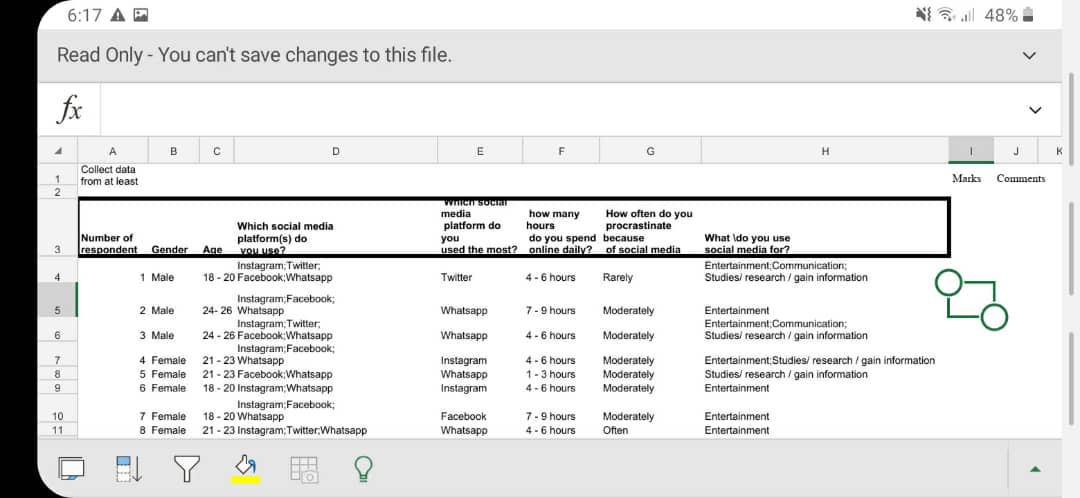
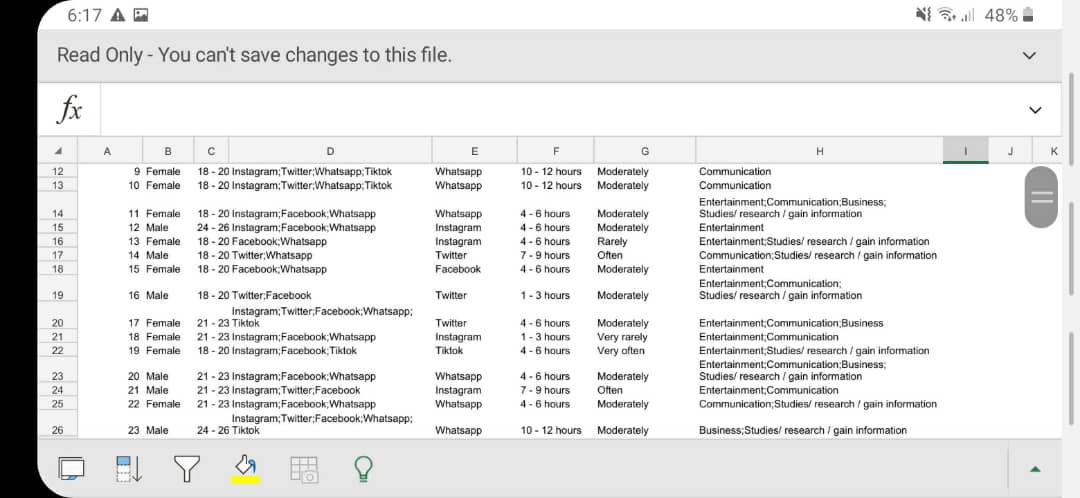
In P2Q2 sheet, choose any suitable quantitative variable (use the raw data), then.
A- compute the three measures of central tendency and interpret the values.
B- compute the skewness values and conclude the data distribution.
-------
So i have to compute the mean median mode for section A and Interpret the measurement.
And for section B i have to do skewness.
--------
Our topic is Usage of social media among students
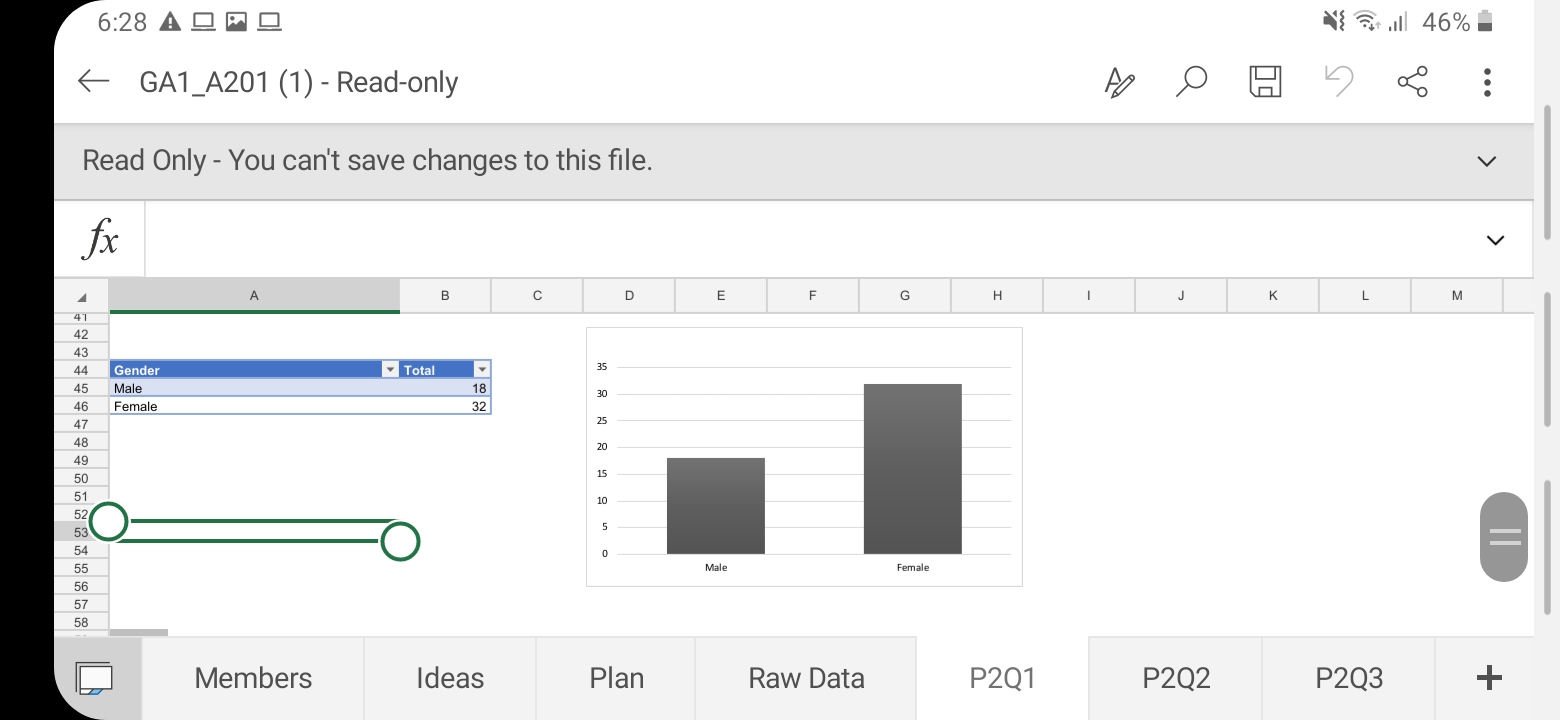
1) Gender: Male/ Female
2) Age: 18 - 21 / 22-25/ 25-27
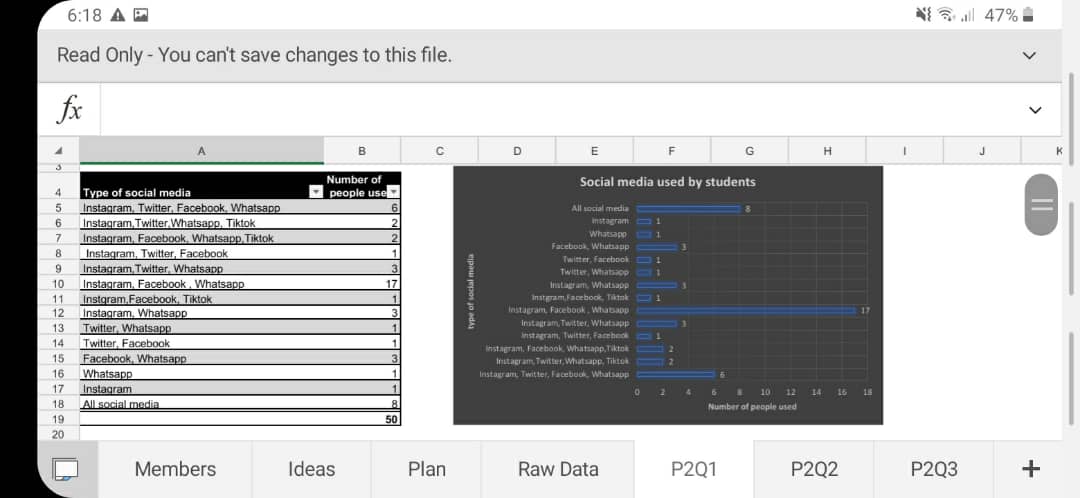
3) Which social media do you use
- Tiktok
- Instagram
- Twitter
- WhatsApp
- Facebook
4) Which social media you used the most?
- Tiktok
-Facebook
- IG.
- Twitter
- Whatsapp
5) How many hours in average you spend online daily?
- 4 hours
- 6 hours
-8 hours
- 10 hours
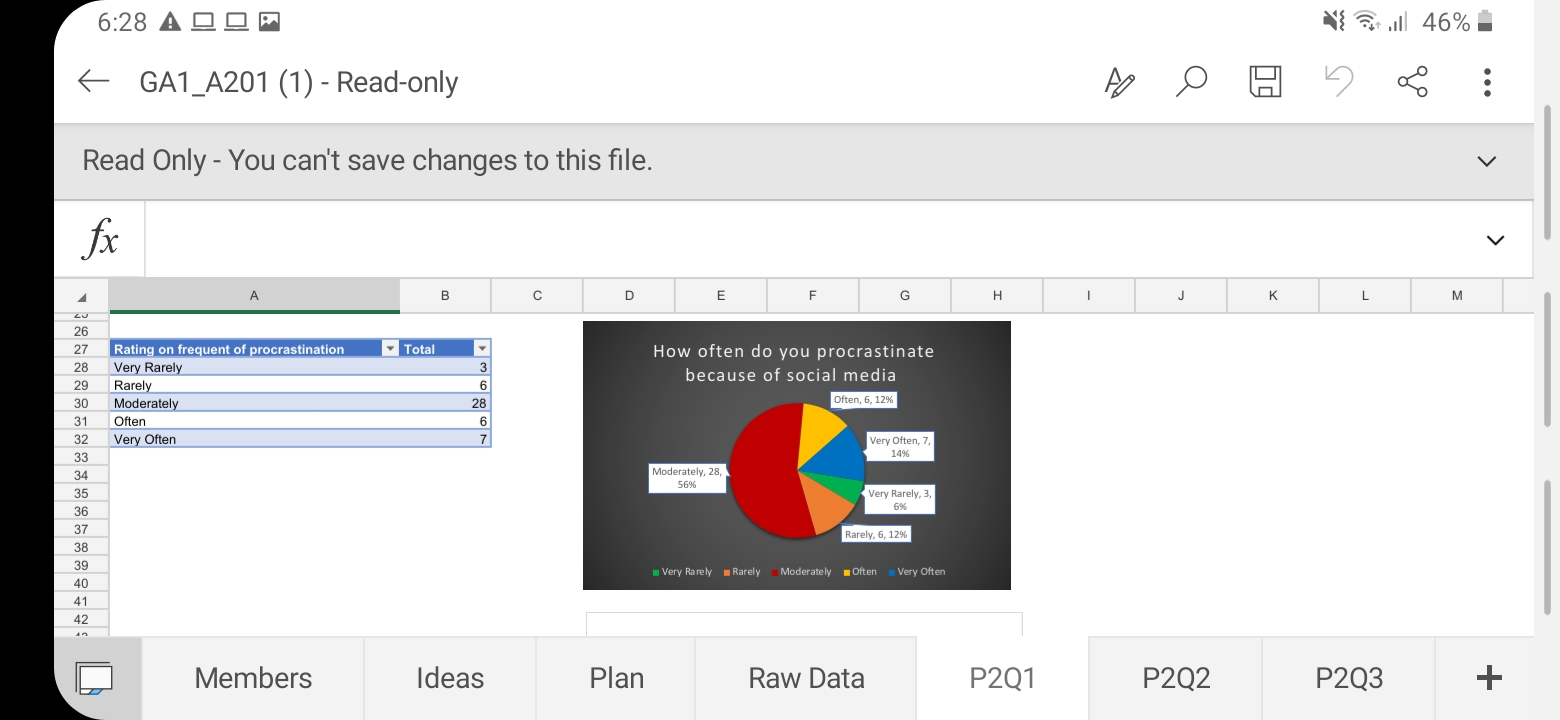
6) how often you procrastinate because of social media ( Very rarely, rarely, moderately, often, very often)
7) What do you use social media for?
-Communication
- Business
- Entertainment
- Studies / Research / Gain information
Variables
i) interval : hours spend online
ii) ratio: age students
iii) nominal: type of social media
iv) ordinal: rating by consumer (procrastination)
--------
Topic: Usage of social media among students.
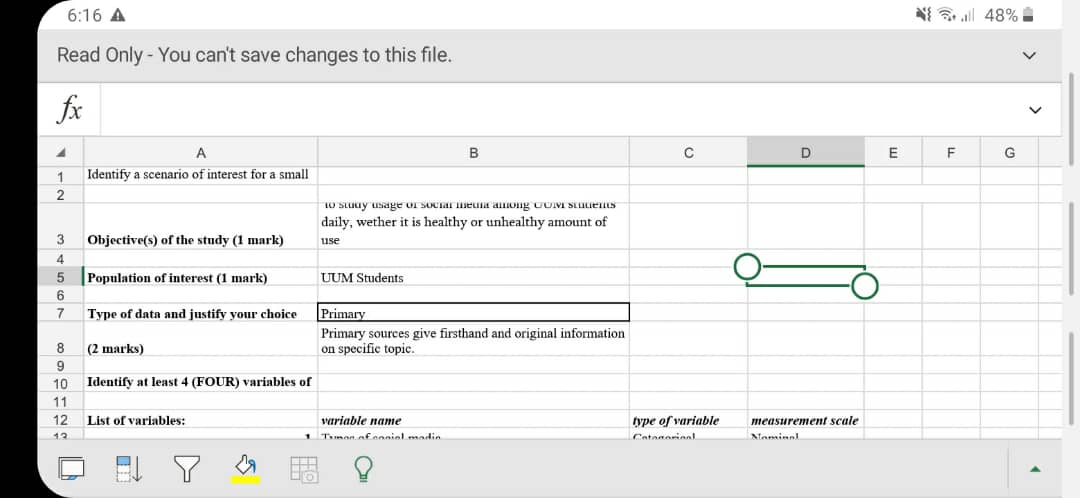
a) objectives: to study usage of social media among UUM student in daily life wether it is healthy or unhealthy amount of use
b)population of interest: UUM student
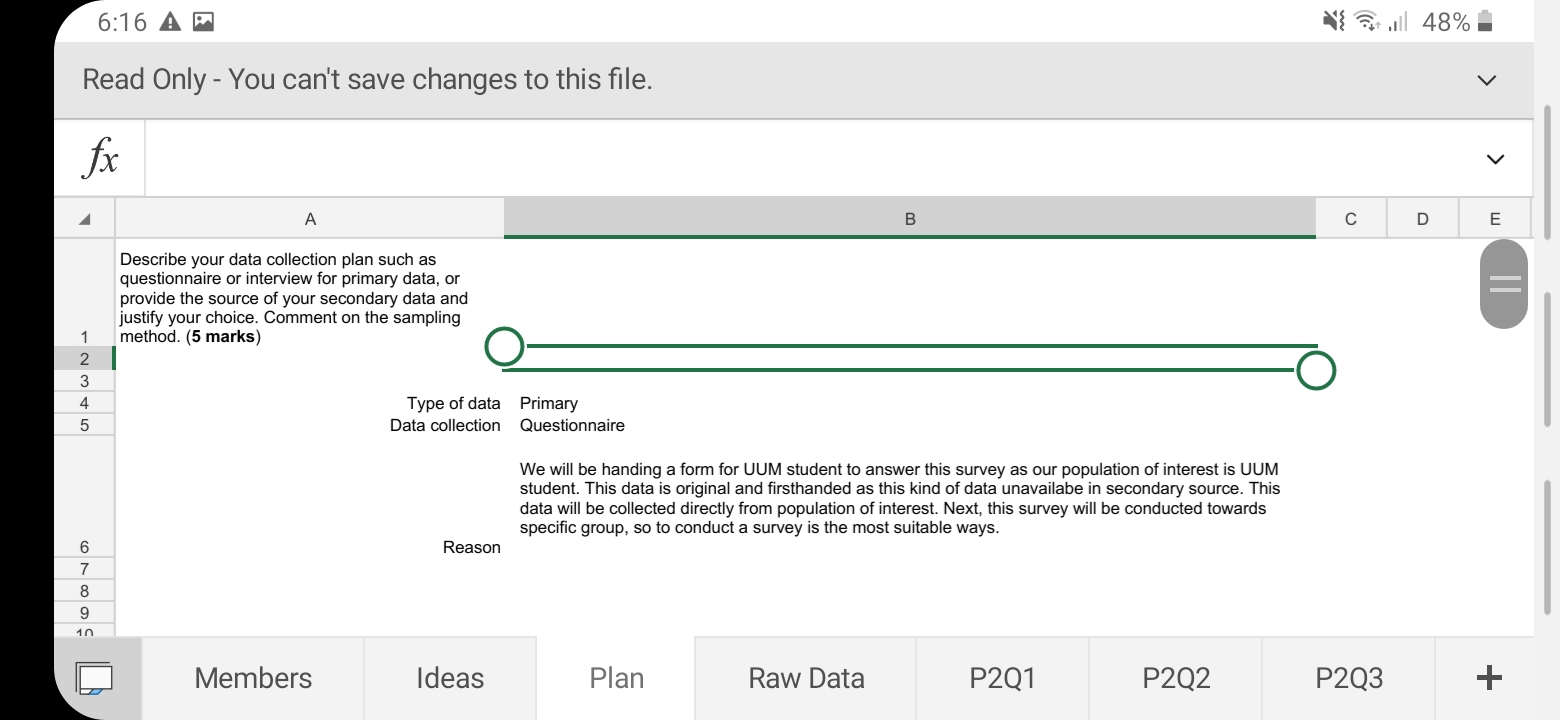
c) type of data: primary
reason:
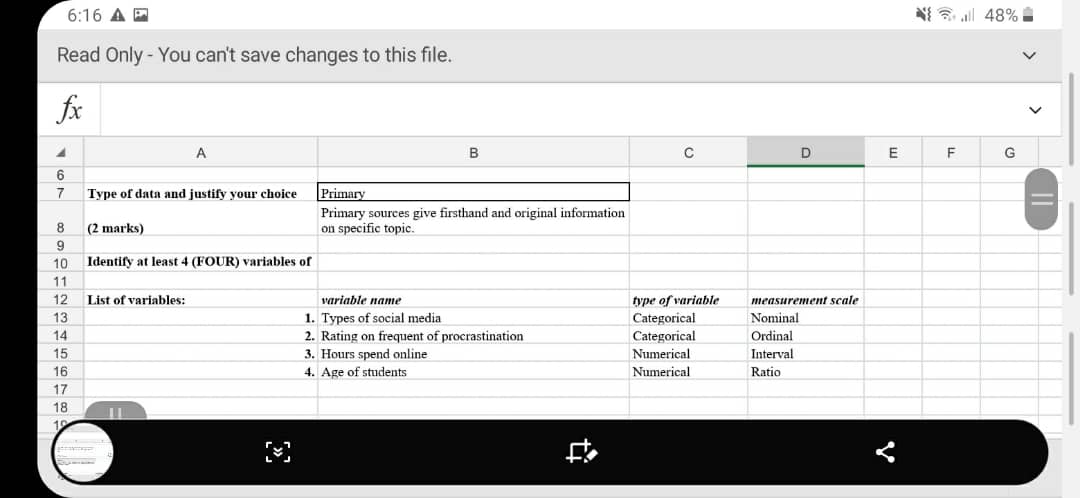
d) variable of interest
i. nominal - type of social media
ii. ordinal - rating by consumer ( frequently used)
iii. interval - percentage of battery consumption after half day
iv. ratio- age of students.
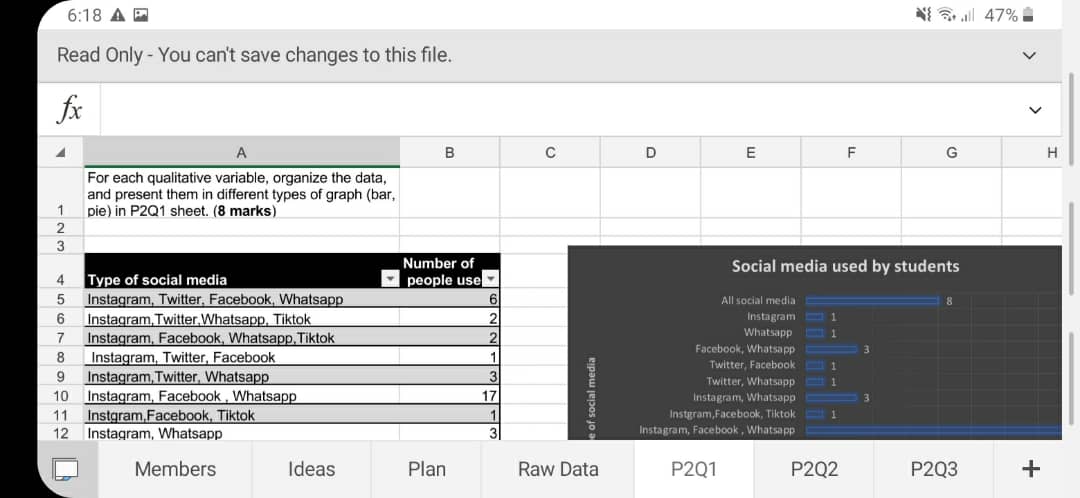
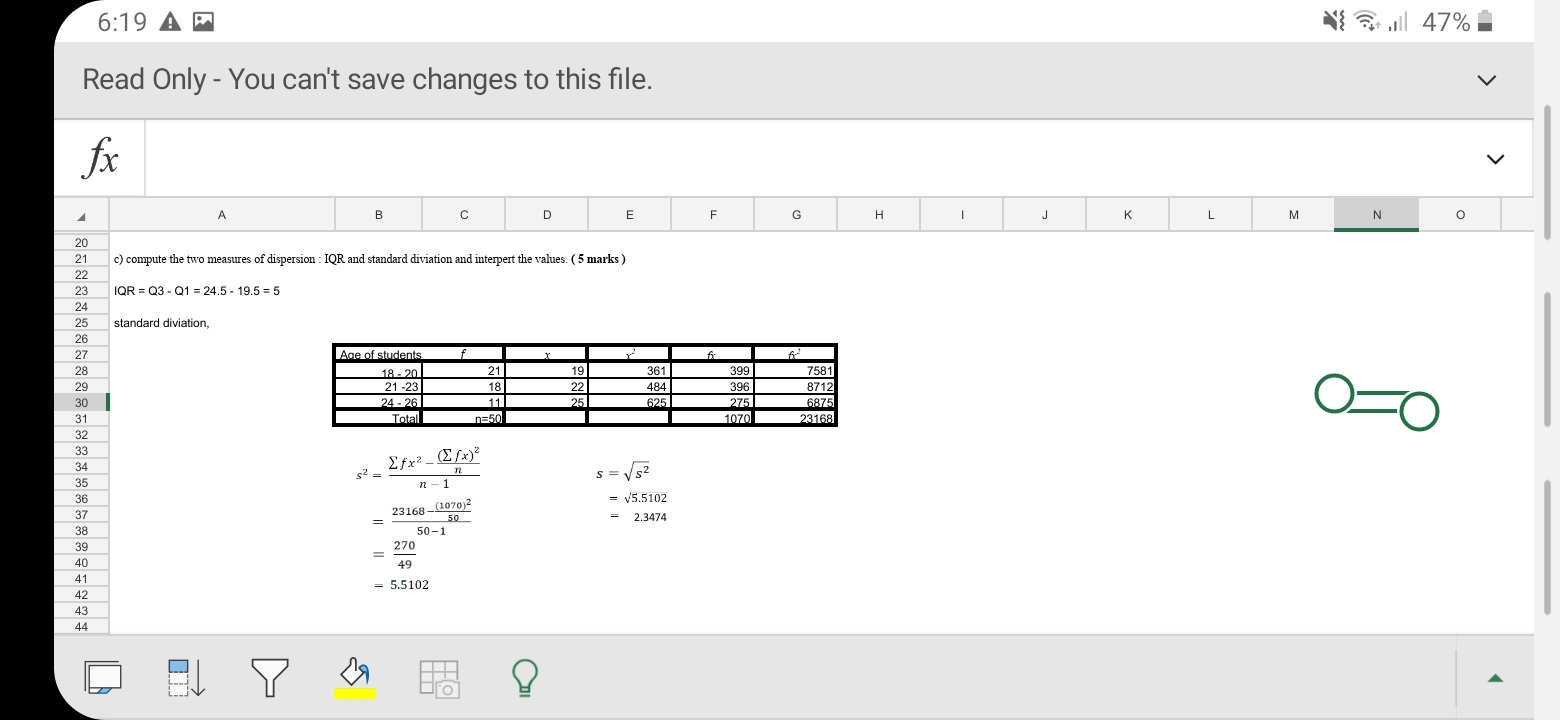
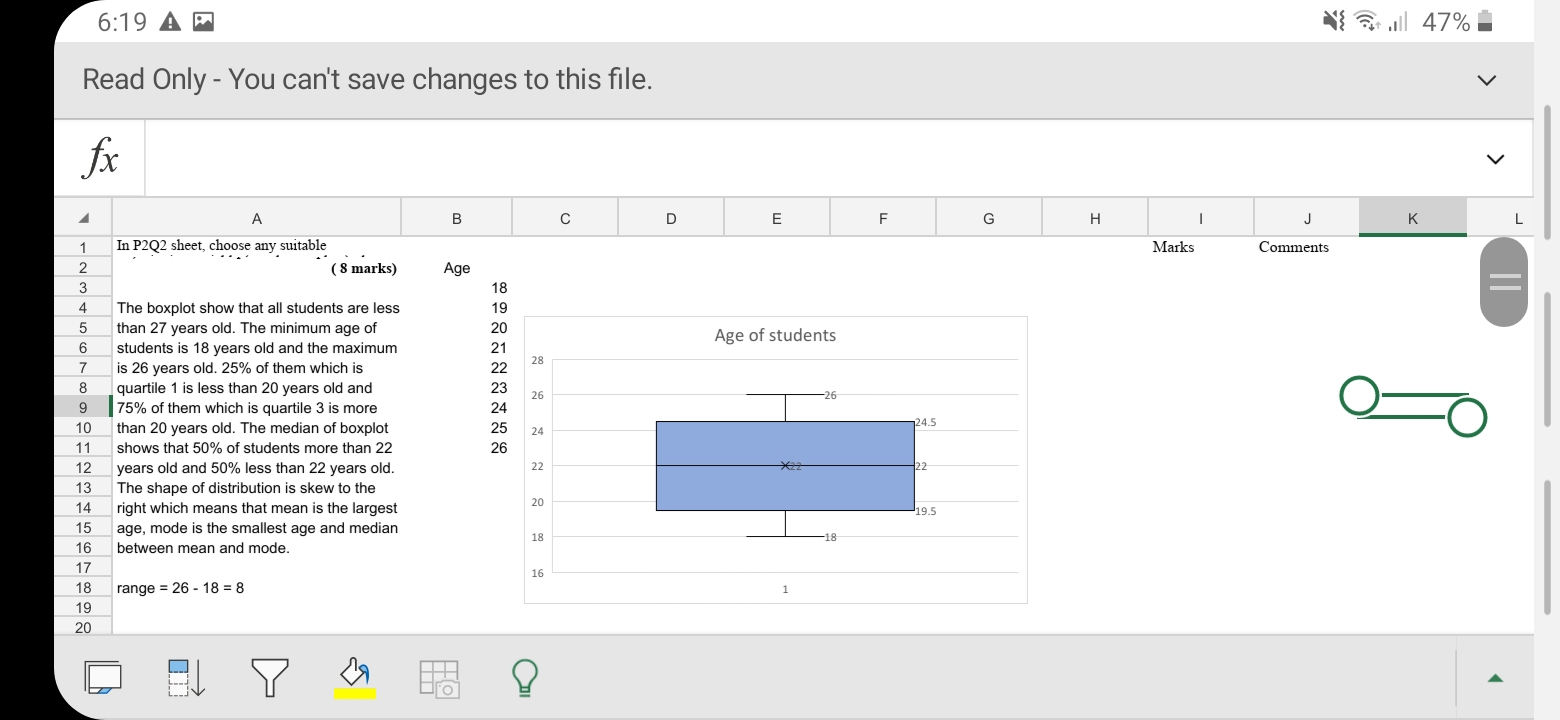
*pls refer to the pics to see my group-mate, EXCEL part that i have to follow in order to answer my part.
* thank you in advance any help will be highly appreciated it
6:18 A P N G all 47% Read Only - You can't save changes to this file. fx V A B C D E F G H J K Number of Type of social media people use Social media used by students 4 5 Instagram. Twitter, Facebook. Whatsapp 6 All social media 6 Instagram Twitter Whatsapp, Tiktok 21 instagram 7 Instagram, Facebook Whatsapp Tiktok Whatapp 8 Instagram, Twitter, Facebook Facebook, Whatsapp Instagram Twitter, Whatsapp type of Local media Twitter Facebook 9 Twitter, Whatstop 10 Instagram. Facebook . Whatsapp imthiram, Whatsapp 11 Instgram. Facebook, Tiktok inargram,Facebook, Tiktok 12 Instagram. Whatsapp Instagram Facebook . Whatsapp 13 Twitter Whatsapp Imitagram. Twitter. Whatsapp 14 Twitter, Facebook Mistagram, Twitter, Farcheck 15 Facebook, Whatsapp Instagram. Facebook. Whatsapp, Tiktok Instagram, Tenter, Whatsapp, Tiktok 16 Whatsapp Instagramt Twitter, Faceticluk, Whatsapp 17 Instagram 12 14 16 18 All social media Number of people used 19 50 20 Members Ideas Plan Raw Data P2Q1 P2Q2 P203 +6:28 A DO P Call 46% GA1_A201 (1) - Read-only . . . Read Only - You can't save changes to this file. V fx V C D E F G H I J K L M A B 26 27 Rating on frequent of procrastination Total How often do you procrastinate 28 Very Rarely because of social media 29 Rarely 30 28 Often, 6, 12% Moderately 31 Often 32 Very Often 7 Very Often, 7, 14% 33 34 Moderately, 28, 56% 35 Very Rarely, 3, 6% 36 37 Rarely, 6, 12% 38 39 . Very Rarely Rarely . Moderately Often . Very Often 40 41 42 Members Ideas Plan Raw Data P2Q1 P2Q2 P2Q3 +Call 46% 6:28 A O PO . . . GA1_A201 (1) - Read-only V Read Only - You can't save changes to this file. V fx H I J K L M E F G A B C D 41 42 43 35 44 Gender Total 45 Male 18 30 46 Female 32 25 47 48 20 49 15 50 10 51 52 53 O- 0 54 O Male Female 55 56 57 58 Ideas P2Q1 P2Q2 P2Q3 + Members Plan Raw Data6:18 A P N Q all 47% Read Only - You can't save changes to this file. fx V A B C D E F G H For each qualitative variable, organize the data, and present them in different types of graph (bar, pie) in P2Q1 sheet. (8 marks) Number of Type of social media people use Social media used by students 5 Instagram, Twitter, Facebook, Whatsapp 6 Instagram, Twitter. Whatsapp, Tiktok Instagram' 7 Instagram, Facebook, Whatsapp, Tiktok NO All social media Whatsapp 8 Instagram, Twitter, Facebook Facebook, Whatsapp Twitter Facebook 9 Instagram, Twitter, Whatsapp 10 Instagram, Facebook , Whatsapp e of social media Twitter, Whatsapp Instagram, Whatsapp 3 11 Instgram, Facebook, Tiktok Instgram, Facebook, Tiktok 1 12 Instagram, Whatsapp Instagram, Facebook , Whatsapp Members Ideas Plan Raw Data P2Q1 P2Q2 P203 +6:19 AP Cat ,Ill 47% Read Only - You can't save changes to this file. fx V A B C D E F G H I J K L M N O 20 21 c) compute the two measures of dispersion : IQR and standard diviation and interpert the values. ( 5 marks ) 22 23 IQR = Q3 - Q1 = 24.5 - 19.5 = 5 24 25 standard diviation, 26 27 Age of students f 28 18 - 20 21 19 361 399 7581 29 21-23 18 22 484 396 8712 30 24 - 26 11 25 625 275 6875 OO 31 Total 0=50 1070 23168 32 33 34 $2- Efx2 _ (Efx) s = VS2 35 n - 1 36 = V5.5102 37 23168 -(1070)2 50 2.3474 38 50-1 39 270 40 49 41 - 5.5102 42 43 446:19 AP Cat ,Ill 47% Read Only - You can't save changes to this file. fx V A B C D E F G H K L OUT A W N - In P2Q2 sheet, choose any suitable Marks Comments ( 8 marks) Age 18 The boxplot show that all students are less 19 than 27 years old. The minimum age of 20 students is 18 years old and the maximum 21 Age of students is 26 years old. 25% of them which is 22 28 8 quartile 1 is less than 20 years old and 23 9 |75% of them which is quartile 3 is more 24 26 26 10 than 20 years old. The median of boxplot 25 24.5 O O 24 11 shows that 50% of students more than 22 26 12 years old and 50% less than 22 years old. 22 22 13 The shape of distribution is skew to the 14 right which means that mean is the largest 20 19.5 15 age, mode is the smallest age and median between mean and mode. 18 18 16 17 16 18 range = 26 - 18 = 8 19 206:16 A N G. all 48% Read Only - You can't save changes to this file. fx V A B C D E F G Identify a scenario of interest for a small 2 to study usage of soum meum among com stueins daily, wether it is healthy or unhealthy amount of 3 Objective(s) of the study (1 mark) use 4 5 Population of interest (1 mark) UUM Students 6 7 Type of data and justify your choice Primary Primary sources give firsthand and original information 8 (2 marks) on specific topic. 9 10 Identify at least 4 (FOUR) variables of 11 12 List of variables: variable name type of variable measurement scale Toman. ofennial marlin Mominal ?6:16 A P N G. all 48% Read Only - You can't save changes to this file. fx V A B C D E F G 6 Type of data and justify your choice Primary Primary sources give firsthand and original information 8 (2 marks) on specific topic. 9 10 Identify at least 4 (FOUR) variables of 11 12 List of variables: variable name type of variable measurement scale 13 1. Types of social media Categorical Nominal 14 2. Rating on frequent of procrastination Categorical Ordinal 15 3. Hours spend online Numerical Interval 16 4. Age of students Numerical Ratio 17 18 10
