

Question
Hello, can someone help me with my conclusion and Calculate the 95% confidence interval and show or describe the method of calculation.] [Interpret the confidence
Hello, can someone help me with my conclusion and Calculate the 95% confidence interval and show or describe the method of calculation.]
[Interpret the confidence 95% confidence interval in context.]
MY PAPER
Introduction
The purpose of this report will determine whether the region of New England's housing prices and square footage are significantly different from the national market. My approach is to calculate a series of tests that will help me make the decision to reject or fail to reject the null hypothesis. The tests that I will be utilizing for my research are one-tailed and two-tailed testing strategies. To generate my random sample for the New England region, in Excel, I used the formula =RAND, which lead me to use the first 100 data samples generated. The states that are going to be included in my sample are: Massachusetts, Vermont, Rhode Island, Connecticut, New Hampshire, and Maine. My null hypothesis is regional mean listing price = national mean listing price being $288,407. My alternate hypothesis is that the regional mean will be greater than the national mean.
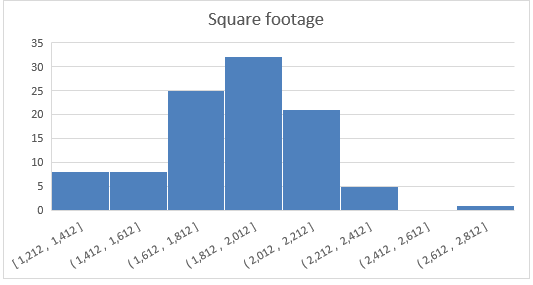
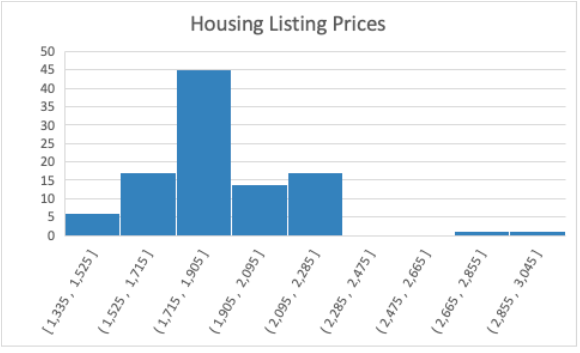
After selecting my sample set of data from New England, I have determined two hypothesis questions and which test would be most appropriate for each. For my first hypothesis question, I will be analyzing if the housing prices in New England are equal to those on the national market. I will be using a right-tailed test to look at the population parameter of the 100 homes within my New England Region. The test statistic is $24.48. Next, I will be analyzing if the square footage in the home of New England different than those of the homes in the national market. The test-statistic being 3.9E. The test that I am going to use for this is a two-tailed test.
1-Tail Test
My population parameter is the housing price mean of $358,599.
Hypothesis: The regional mean listing price = the national listing price of $288,407.
Null Hypothesis: The mean listing price > the national listing price of $288,407.
Level of significance: 95%
Step by Step Solution
There are 3 Steps involved in it
Step: 1

Get Instant Access to Expert-Tailored Solutions
See step-by-step solutions with expert insights and AI powered tools for academic success
Step: 2

Step: 3
Ace Your Homework with AI
Get the answers you need in no time with our AI-driven, step-by-step assistance
Get Started
Practical Linear Algebra A Geometry Toolbox
Authors: Gerald Farin, Dianne Hansford
4th Edition
1003051219, 9781003051213