

Question
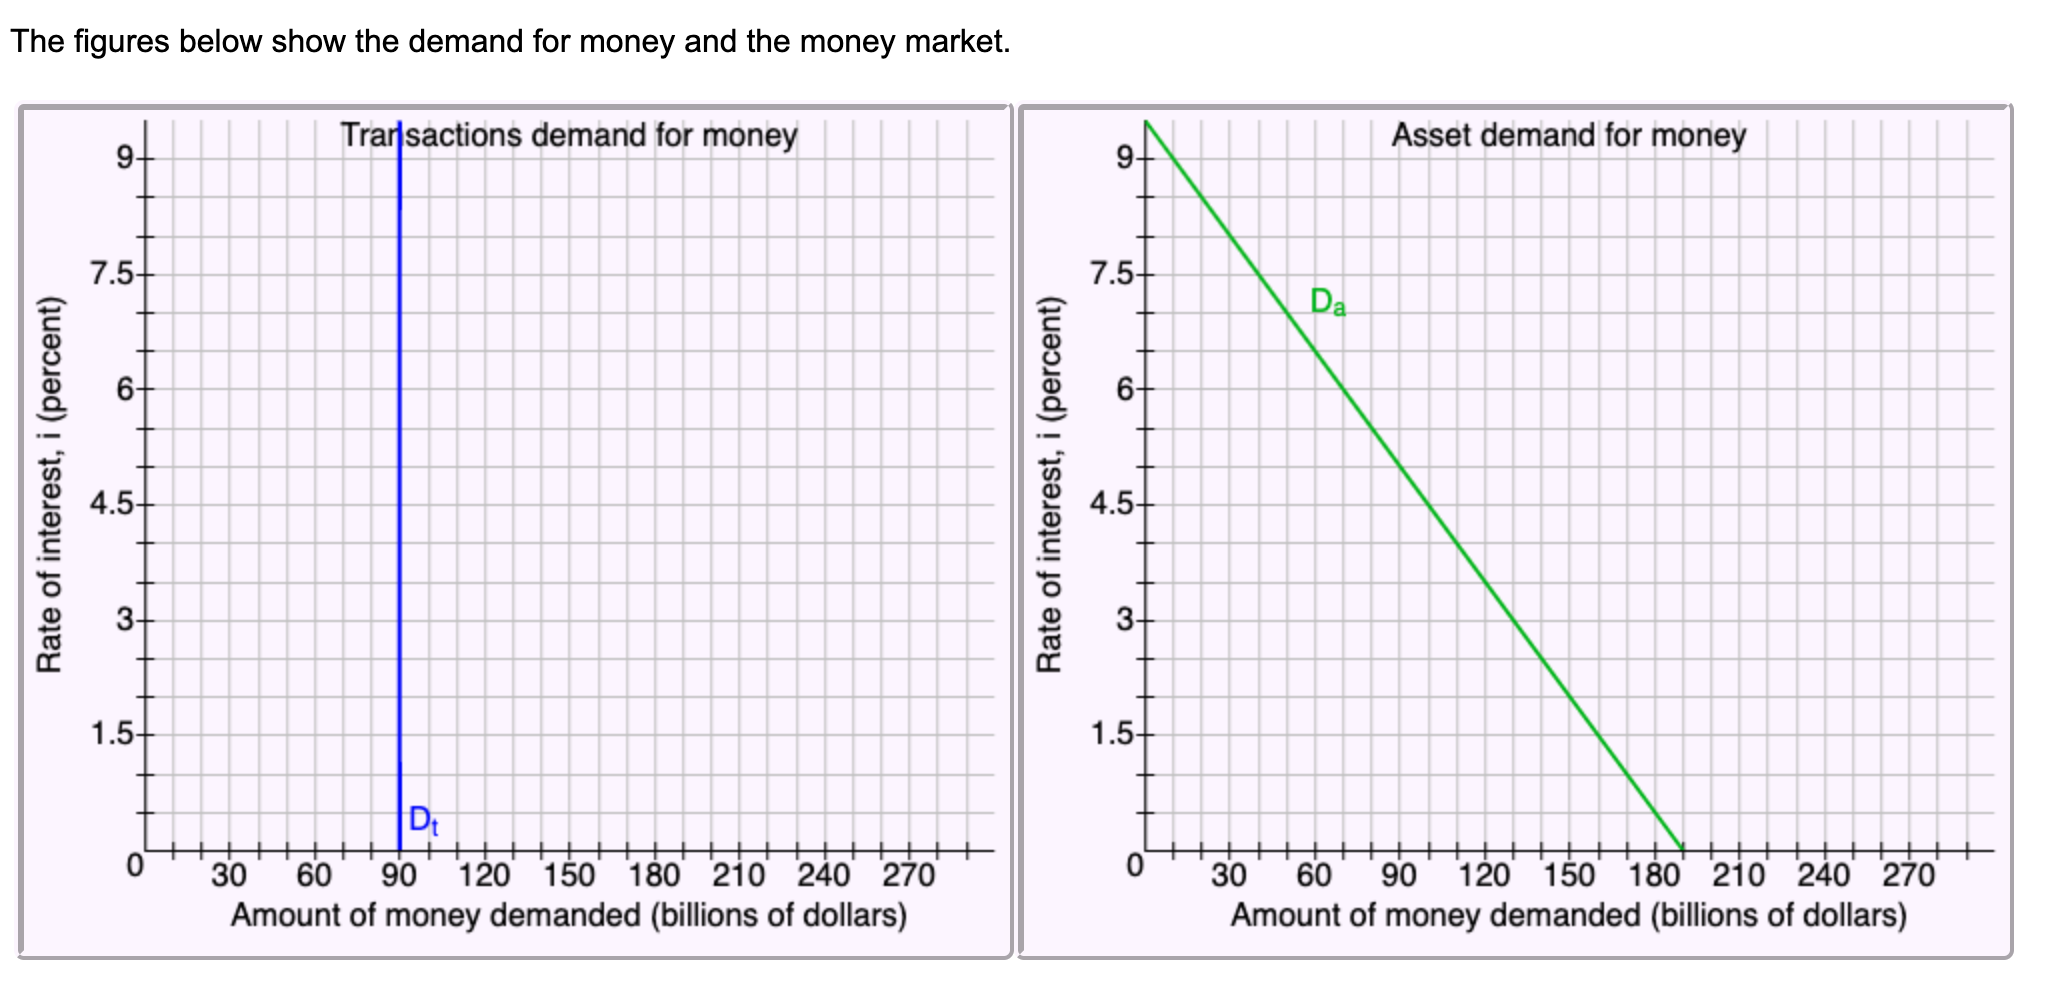
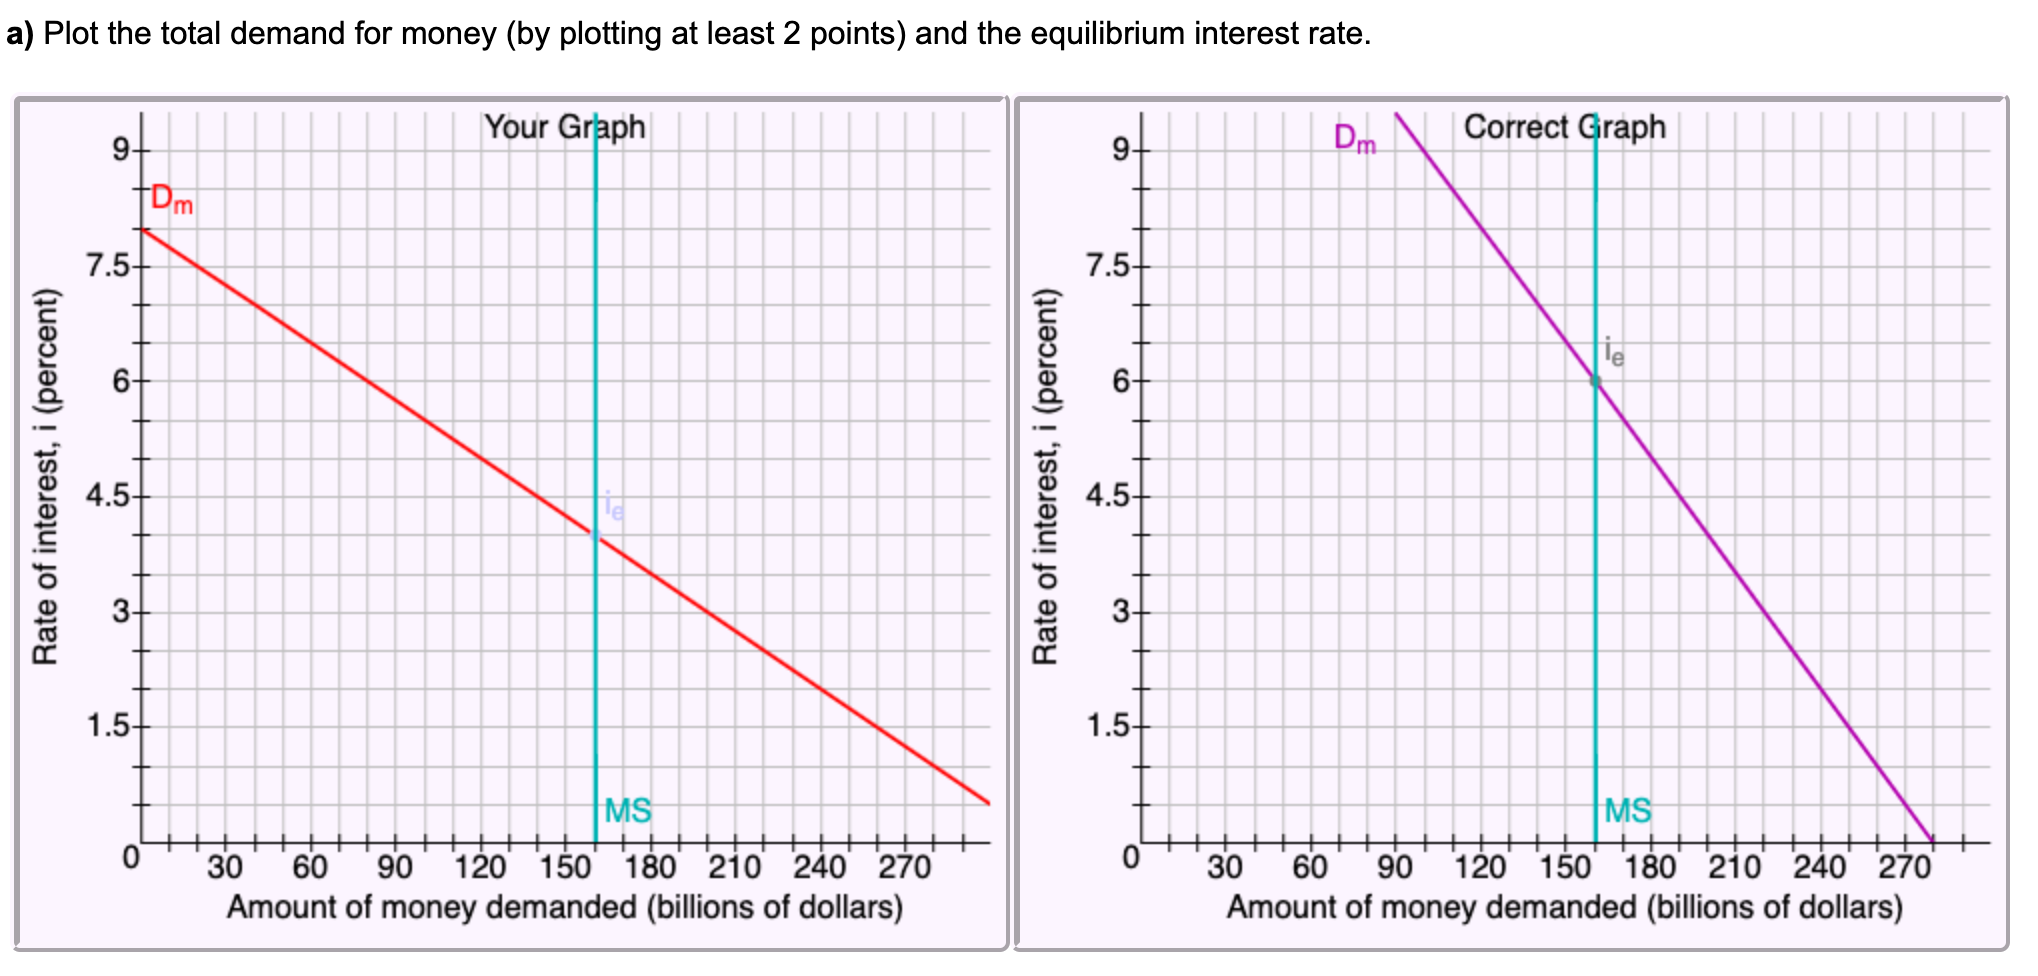
Hello, can someone please explain to me what i need to do/use to plot the new money demand curve, I am so lost, what do
Hello, can someone please explain to me what i need to do/use to plot the new money demand curve, I am so lost, what do i need to take into consideration based on the graphs in order to plot the new Money Demand Curve. I would appreciate the help, thank you!
Step by Step Solution
There are 3 Steps involved in it
Step: 1

Get Instant Access to Expert-Tailored Solutions
See step-by-step solutions with expert insights and AI powered tools for academic success
Step: 2

Step: 3
Ace Your Homework with AI
Get the answers you need in no time with our AI-driven, step-by-step assistance
Get Started
Managerial economics applications strategy and tactics
Authors: James r. mcguigan, R. Charles Moyer, frederick h. deb harris
12th Edition
9781133008071, 1439079234, 1133008070, 978-1439079232