Hello guys please need urgent answer for this question i will like your answer thank you

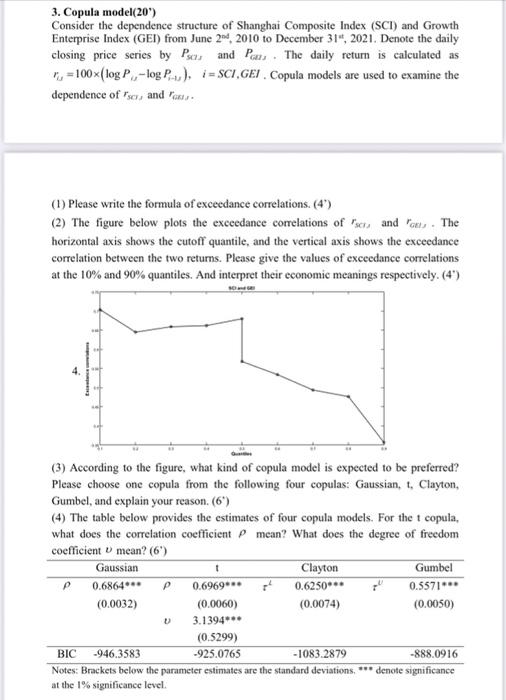
3. Copula model(20) Consider the dependence structure of Shanghai Composite Index (SCI) and Growth Enterprise Index (GEI) from June 2nd, 2010 to December 31, 2021. Denote the daily closing price series by P and P The daily return is calculated as i=SCI,GEI. Copula models are used to examine the =100x (log P,-log P), dependence of scr, and a (1) Please write the formula of exceedance correlations. (4') (2) The figure below plots the exceedance correlations of scand - The horizontal axis shows the cutoff quantile, and the vertical axis shows the exceedance correlation between the two returns. Please give the values of exceedance correlations at the 10% and 90% quantiles. And interpret their economic meanings respectively. (4") 12 (3) According to the figure, what kind of copula model is expected to be preferred? Please choose one copula from the following four copulas: Gaussian, t, Clayton, Gumbel, and explain your reason. (6") (4) The table below provides the estimates of four copula models. For the t copula, what does the correlation coefficient mean? What does the degree of freedom coefficient mean? (6') Gaussian t Clayton Gumbel P 0.6864 P 0.6969 7 0.6250*** 0.5571*** (0.0032) (0.0060) (0.0074) (0.0050) V 3.1394*** (0.5299) BIC -946.3583 -925.0765 -1083.2879 -888.0916 Notes: Brackets below the parameter estimates are the standard deviations. *** denote significance at the 1% significance level. 3. Copula model(20) Consider the dependence structure of Shanghai Composite Index (SCI) and Growth Enterprise Index (GEI) from June 2nd, 2010 to December 31, 2021. Denote the daily closing price series by P and P The daily return is calculated as i=SCI,GEI. Copula models are used to examine the =100x (log P,-log P), dependence of scr, and a (1) Please write the formula of exceedance correlations. (4') (2) The figure below plots the exceedance correlations of scand - The horizontal axis shows the cutoff quantile, and the vertical axis shows the exceedance correlation between the two returns. Please give the values of exceedance correlations at the 10% and 90% quantiles. And interpret their economic meanings respectively. (4") 12 (3) According to the figure, what kind of copula model is expected to be preferred? Please choose one copula from the following four copulas: Gaussian, t, Clayton, Gumbel, and explain your reason. (6") (4) The table below provides the estimates of four copula models. For the t copula, what does the correlation coefficient mean? What does the degree of freedom coefficient mean? (6') Gaussian t Clayton Gumbel P 0.6864 P 0.6969 7 0.6250*** 0.5571*** (0.0032) (0.0060) (0.0074) (0.0050) V 3.1394*** (0.5299) BIC -946.3583 -925.0765 -1083.2879 -888.0916 Notes: Brackets below the parameter estimates are the standard deviations. *** denote significance at the 1% significance level


