Hello I have a math project and I need help doing statistical study on experimental vs. control group. And this requires any existing data or survey with is up to 20 (n). And they expecting us to answer an essay on our final results doesn't matter how long but he just wants a feedback how we did it without any timing.
And for each group he wants a following statistics for mean , median, mode , standard deviation, variance, range and maximum, minimum and interquartile range.
And do test outliers for both sampling . with plots and graphs
Thank you, and there is no data or anything required for this . We just have to make up an experiment of our own
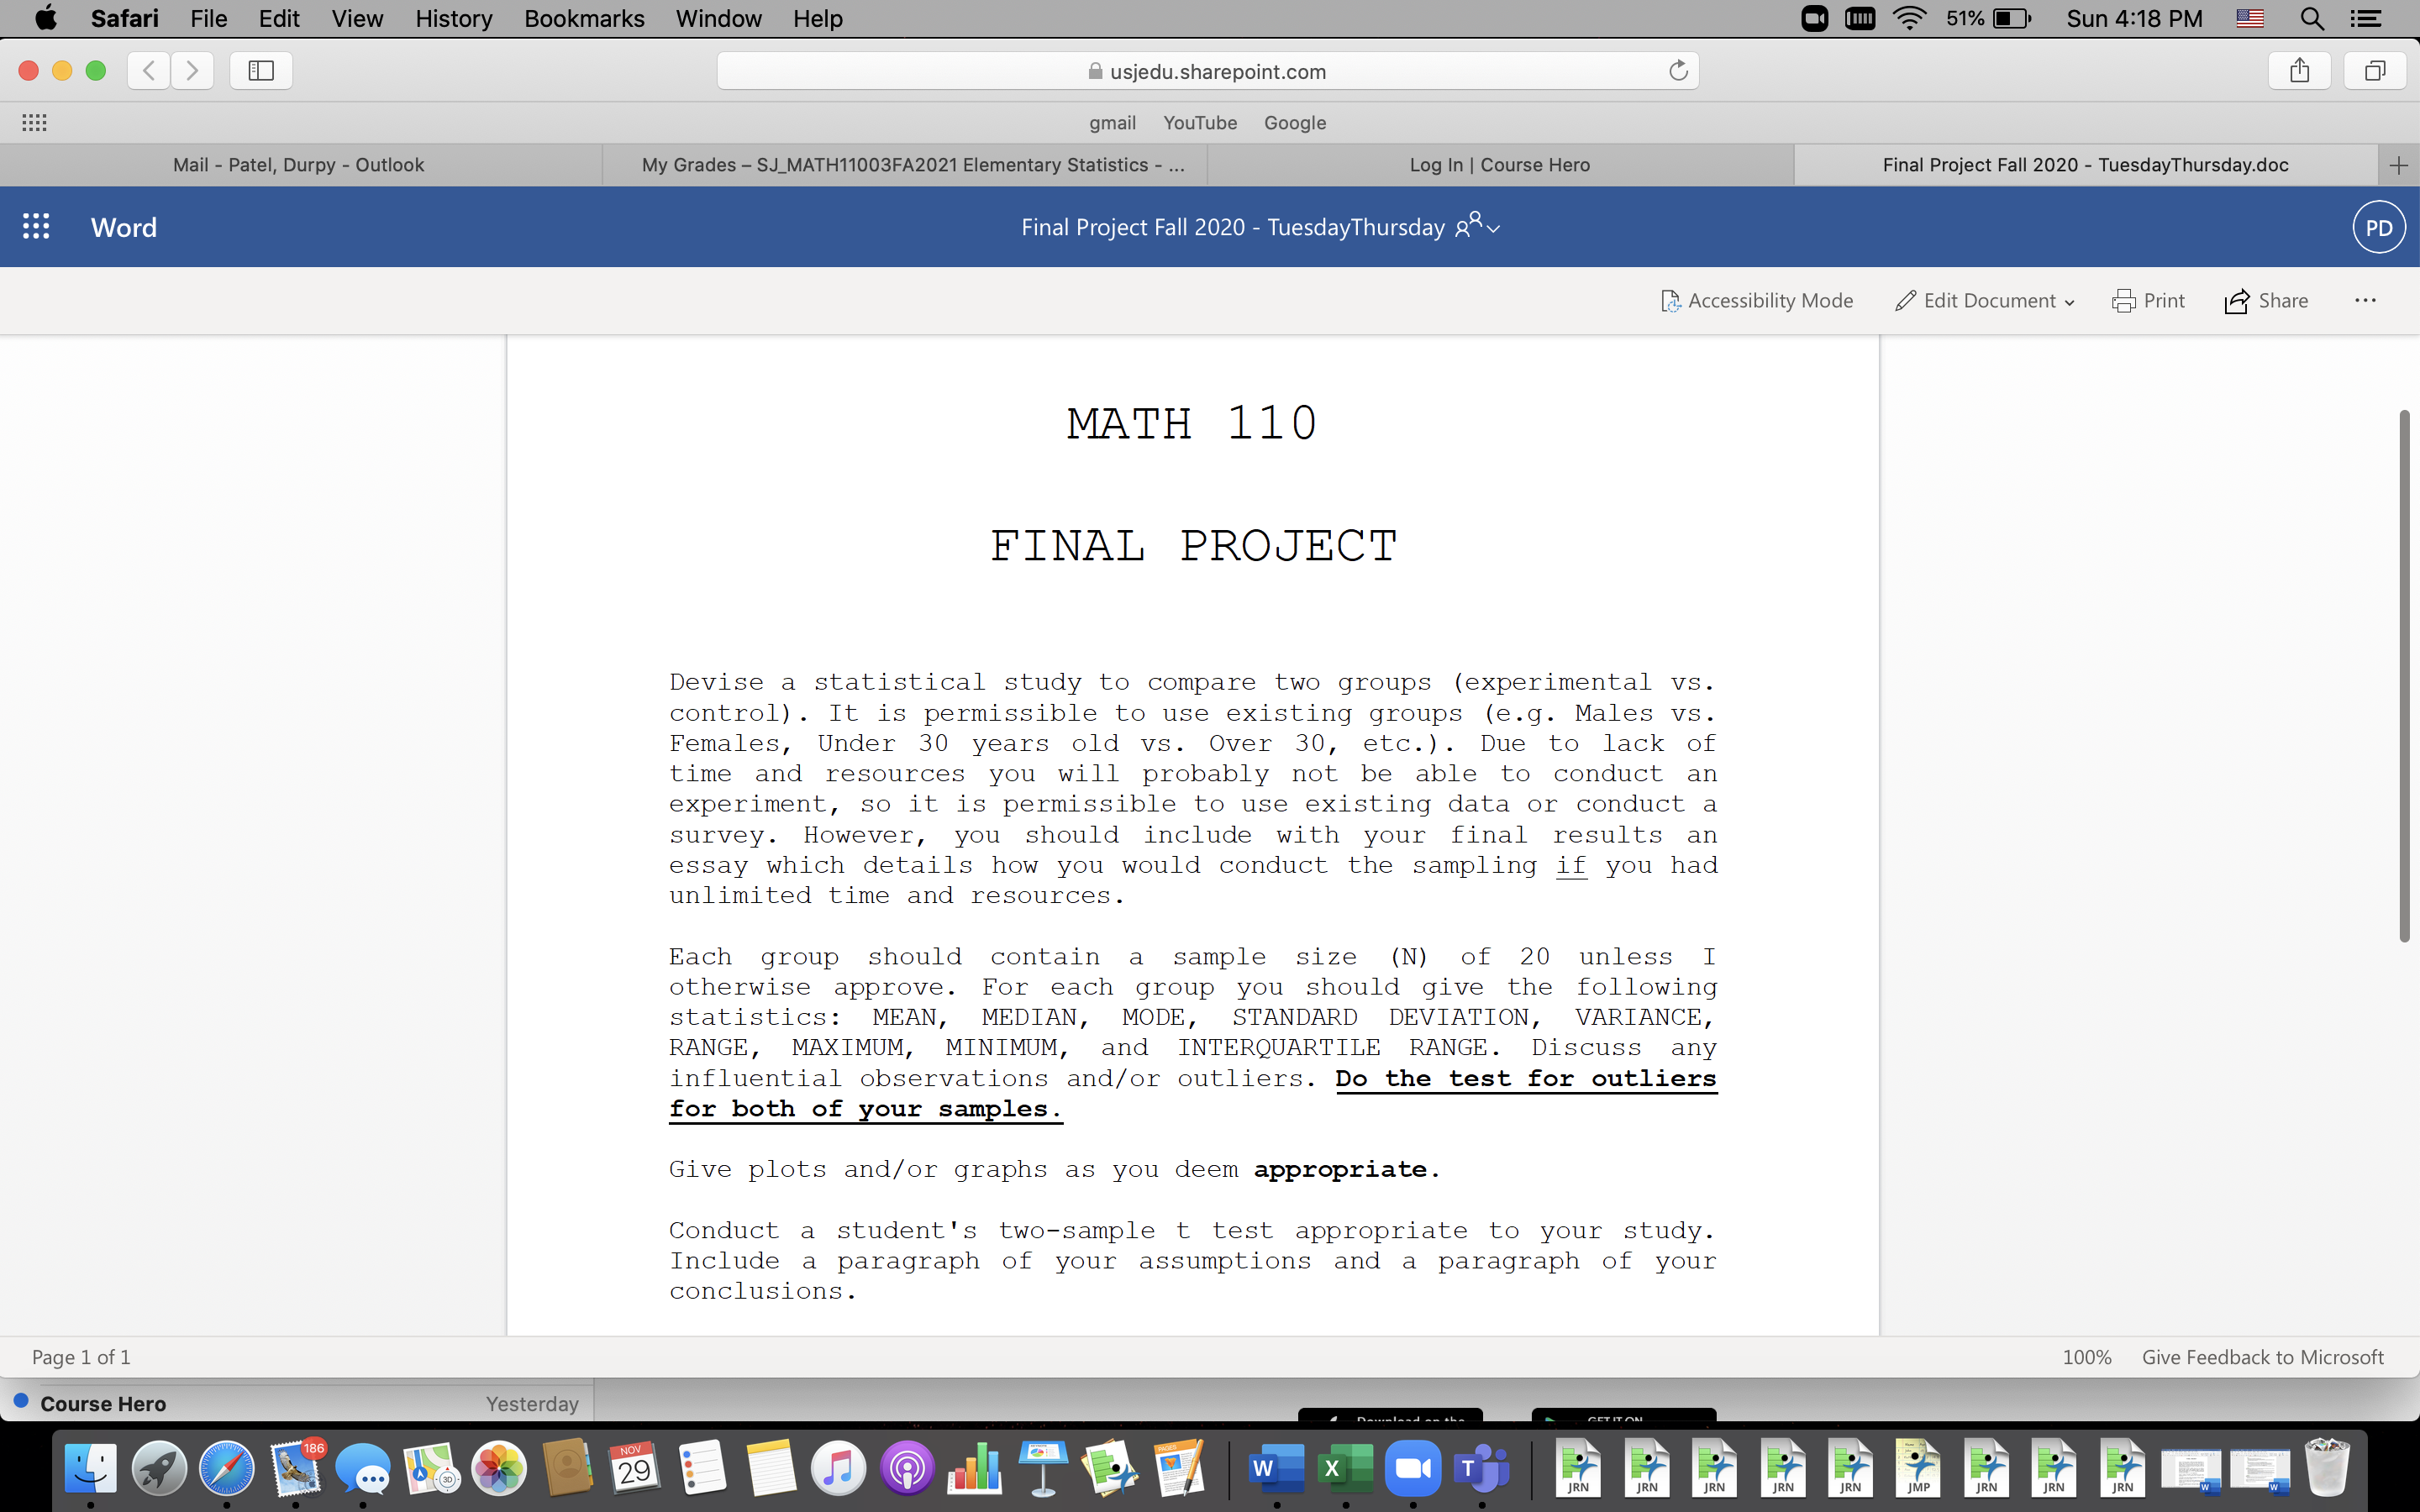
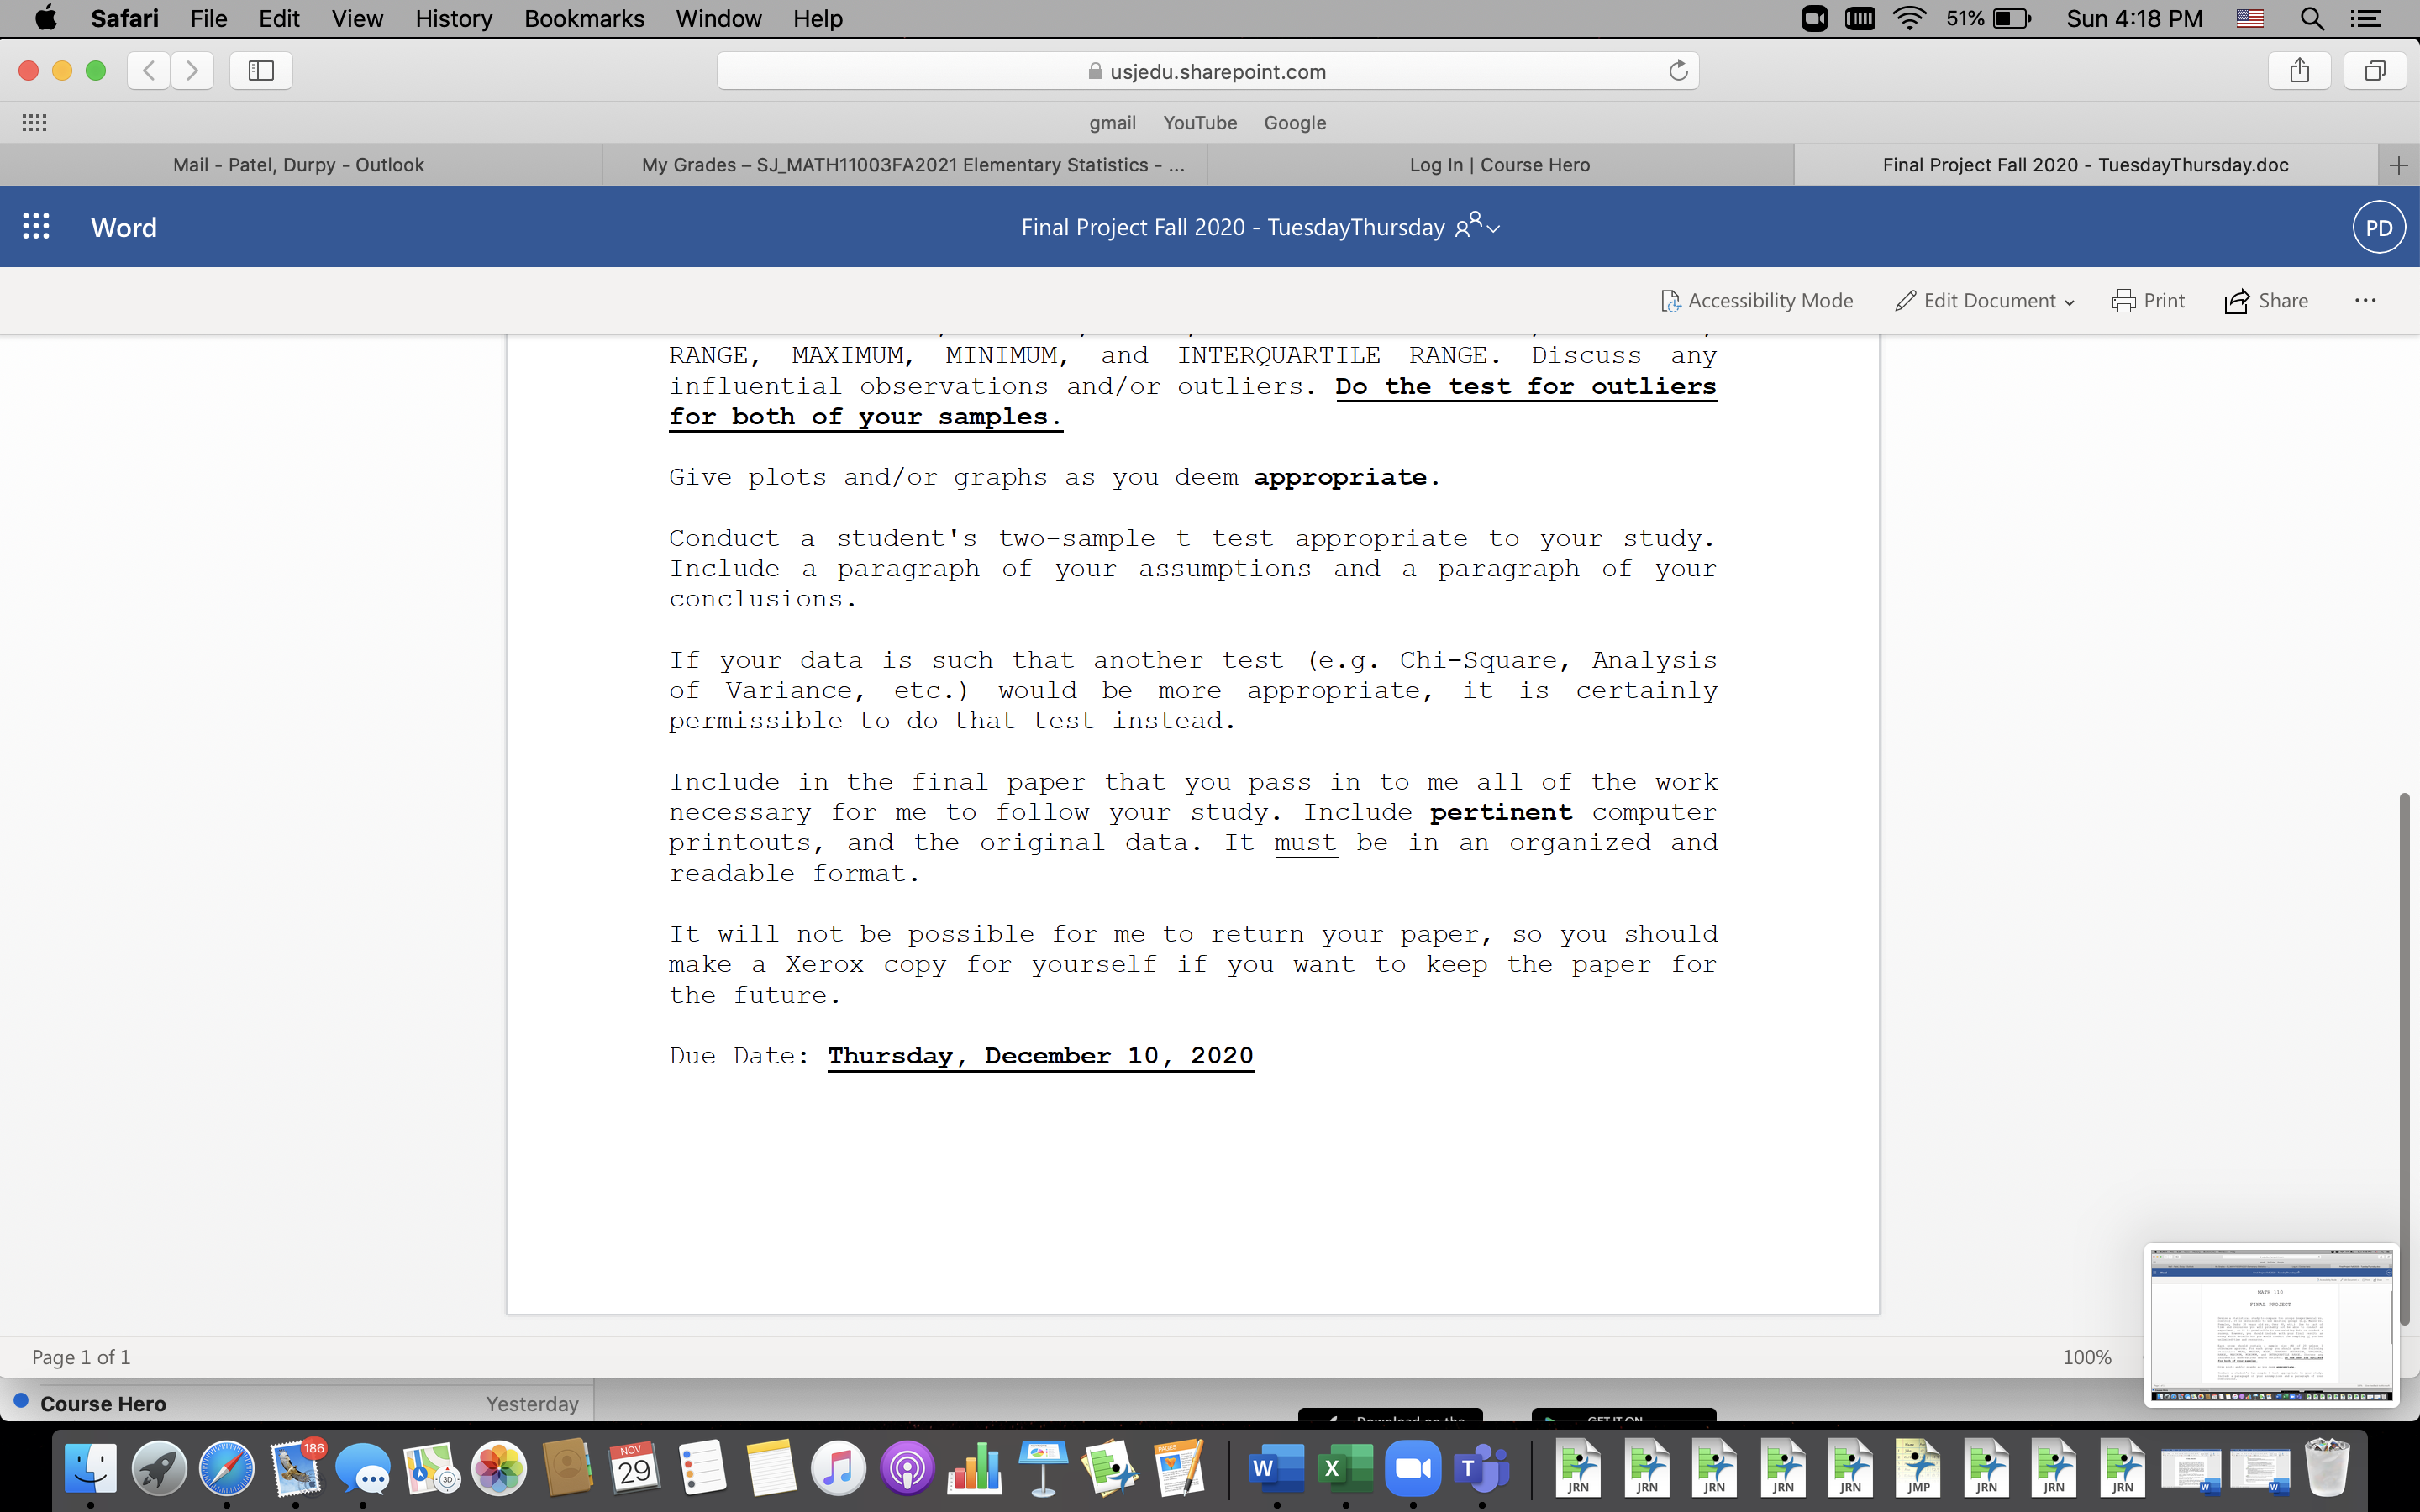
usjedusharepointcom 0 r11 5' gmall Vom'ube Gougle Fmal Proyect Fall 2020 , TuesdayThursday RQ\\ [5} Accessibility Mode / Edit Document v :31 Print a Share MATH 110 FINAL PROJECT Devise a statistical study to compare two groups (experimental vs. control). It is permissible to use existing groups (e.g. Males vs. Females, Under 30 years old vs. Over 30, etc.). Due to lack of time and resources you will probably not be able to conduct an experiment, so it is permissible to use existing data or conduct a survey. However, you should include with your final results an essay which details how you would conduct the sampling g you had unlimited time and resources. Each group should contain a sample size (N) of 20 unless I otherwise approve. For each group you should give the following statistics: MEAN, MEDIAN, MODE, STANDARD DEVIATION, VARIANCE, RANGE, MAXIMUM, MINIMUM, and INTERQUARTILE RANGE. Discuss any influential observations and/or outliers. Do the test for outliers for both of your saples. Give plots and/or graphs as you deem appropriate. Conduct a student's two-sample t test appropriate to your study. Include a paragraph of your assumptions and a paragraph of your conclusions. Page 1 of 1 100% Give Feedback to Microsoft cue'aaio@t:onw4?~'mmummnmmmno Safari File Edit View History Bookmarks Window Help 1 51% Sun 4:18 PM Q E ... usjedu.sharepoint.com C 1 YouTube Google Mail - Patel, Durpy - Outlook My Grades - SJ_MATH11003FA2021 Elementary Statistics - ... Log In | Course Hero Final Project Fall 2020 - TuesdayThursday.doc + Word Final Project Fall 2020 - TuesdayThursday " PD Accessibility Mode Edit Document v Print 15 Share . .. RANGE, MAXIMUM, MINIMUM, and INTERQUARTILE RANGE. Discuss any influential observations and/or outliers. Do the test for outliers for both of your samples. Give plots and/or graphs as you deem appropriate. Conduct a student's two-sample t test appropriate to your study. Include a paragraph of your assumptions and a paragraph of your conclusions . If your data is such that another test (e.g. Chi-Square, Analysis of Variance, etc. ) would be more appropriate, it is certainly permissible to do that test instead. Include in the final paper that you pass in to me all of the work necessary for me to follow your study. Include pertinent computer printouts, and the original data. It must be in an organized and readable format. It will not be possible for me to return your paper, so you should make a Xerox copy for yourself if you want to keep the paper for the future. Due Date: Thursday, December 10, 2020 KATH 120 Page 1 of 1 100% . Course Hero Yesterday GET IT ON NOV 29 w X T IRN TMP