Question
Hello, I have a question about logistic regression. Please help! In a survey study, the age of women, desire of having more children (1= yes
Hello, I have a question about logistic regression. Please help!
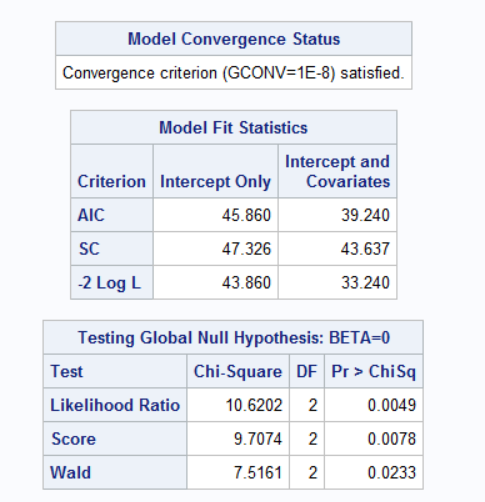
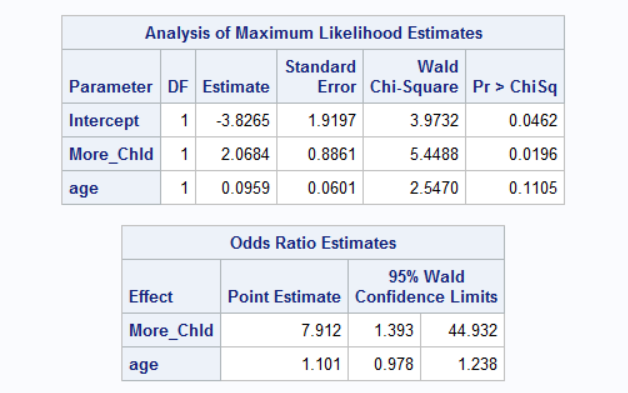
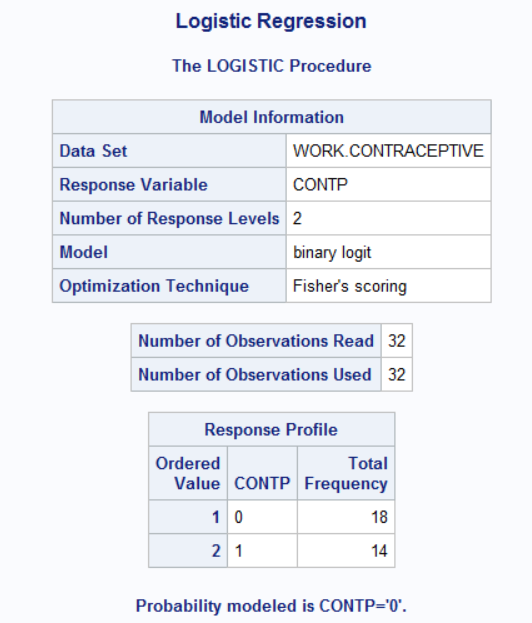
In a survey study, the age of women, desire of having more children (1= yes and 0=No) and contraceptive use (1=yes and 0=No) information were collected.The researchers want to investigate whether there is any evidence that age and desire of having more children are associated with the contraceptive use. They analyze the data using SAS's LOGISTIC procedure and observe the results shown in the Table given below. Please let me know how to solve the following questions based on the info given.
1)What are the dependent variable and the independent variables? And what are the Omnibus Null and Alternative hypotheses.
2)Report the test statistic and P-value that should be used to test the Omnibus Null hypothesis (i.e. "Global Null" per SAS). What can we conclude about the Omnibus Null hypothesis?
3)Report the odds ratios and 95% confidence intervals for all two independent variables. Based on those confidence intervals, which of the independent variables are significant predictors of contraceptive use and which ones are not significant predictors? Why?
4)Report p-values of all two independent variables using "Analysis of Maximum Likelihood Estimates" table in the SAS output. Based on the p-values, which of the independent variables are significant predictors of contraceptive use and which ones are not significant predictors? Why? The reasoning should be based on comparison to Q3.
5)What do these findings mean from public health perspective?
Table 2: Output for Part Two


Step by Step Solution
There are 3 Steps involved in it
Step: 1

Get Instant Access to Expert-Tailored Solutions
See step-by-step solutions with expert insights and AI powered tools for academic success
Step: 2

Step: 3

Ace Your Homework with AI
Get the answers you need in no time with our AI-driven, step-by-step assistance
Get Started


