Question
Hello, I just need the answer for number 7, ad also can you please answer if I need to draw the graph for number 1?
Hello, I just need the answer for number 7, ad also can you please answer if I need to draw the graph for number 1? This is the full information, and I just need number 7, and if you could, the graph for no1
I have written question 7 below
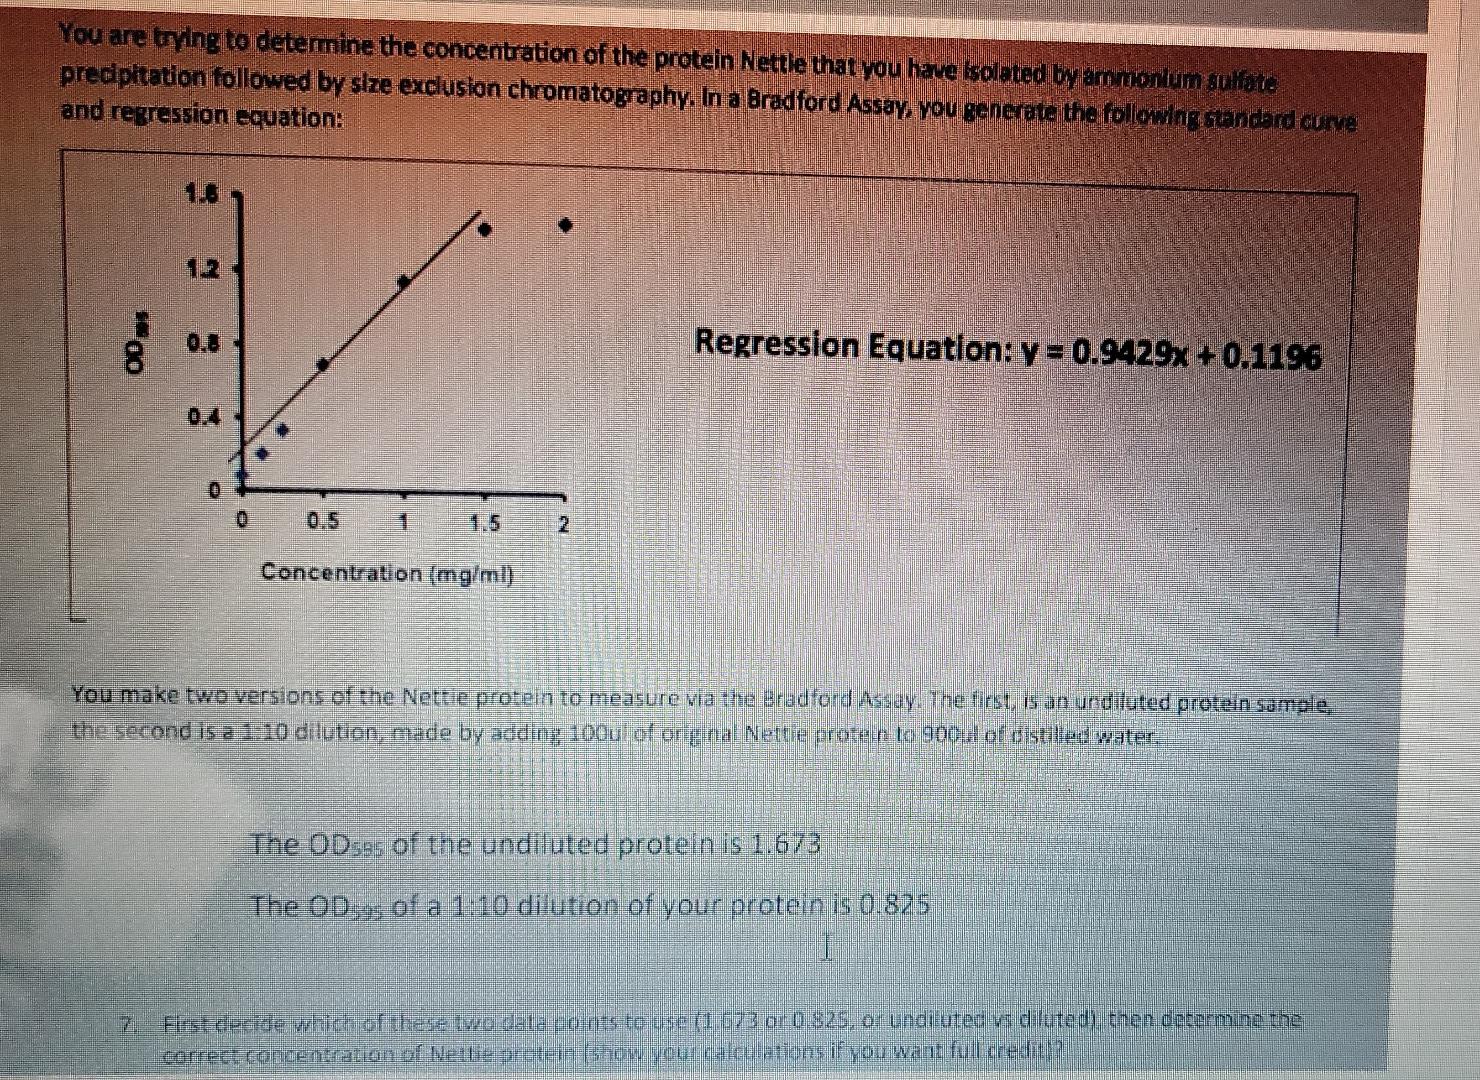
7. First decide which of these two data points to use (1.673 or 0.825, or undiluted vs diluted), then determine the correct concentration of Nettie protein .
Answers
1. Graph is already given.
2. The equation of regression line is :
y= 0.9429x +0.1196
Where y is OD at 595nm
and x is protein concentration.
3. The concentration of protein
y= 0.9429x +0.1196
rearrgange for x:
In 1:10 dilution, 0.825
x = (y -0.1196)/0.9429
Given y = 1.673
= (0.825-0.1196)/0.9429
= 0.748
Dilution correction = 0.748*10 = 7.48 mg/ml
Diluiton is necessary to prevent interference of low pH achieved by the acid in the reagent.
4. Wavelength at 595nm is better to measure the absorbance at which eak of absorption spectra is observed.
5. % Transmittance is the percent of light that passes completely through the sample, whereas, % absorbance is fraction of light absorbed by the sample.
6. Data most often expressed in % absorbance.
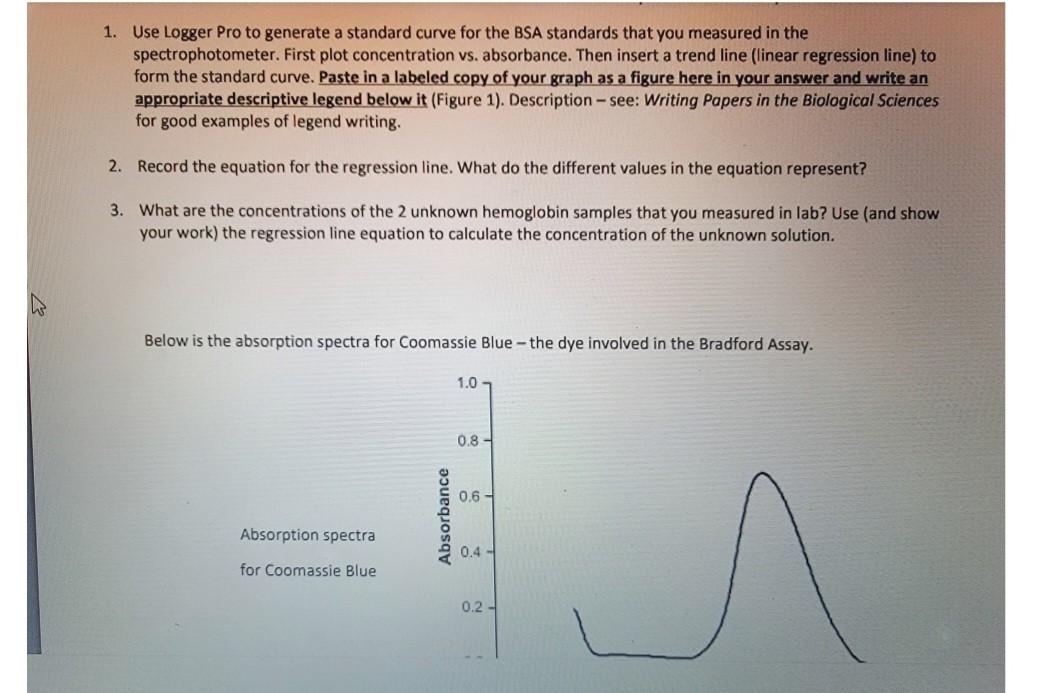
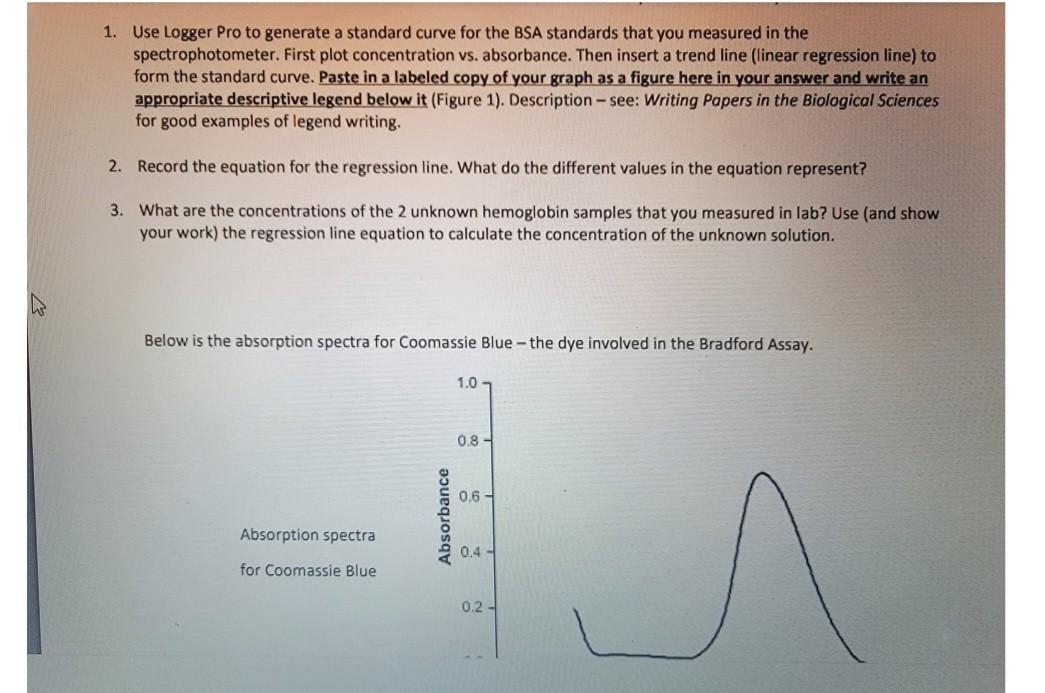
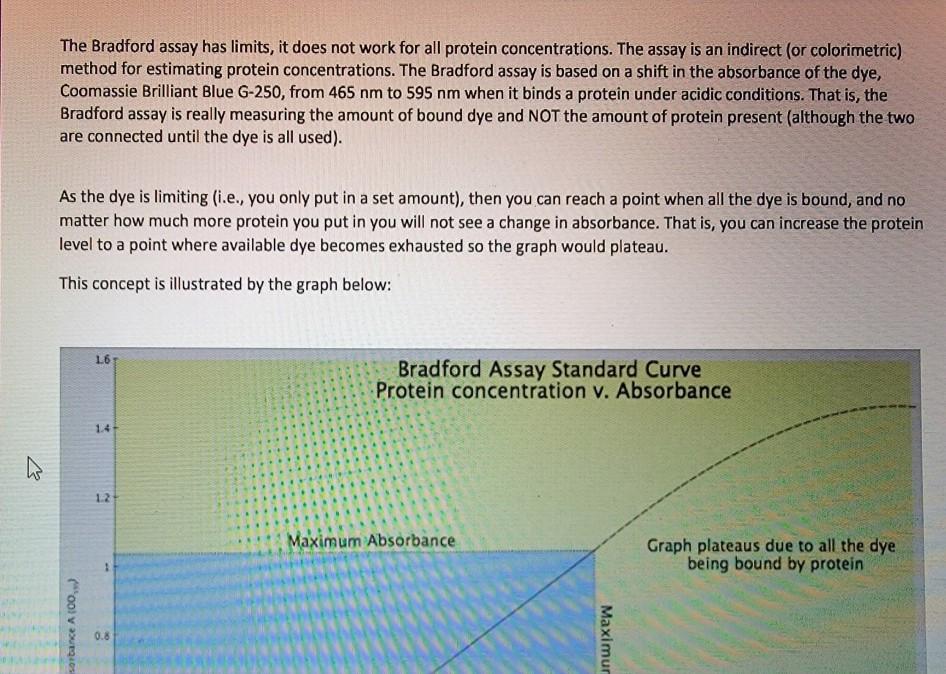
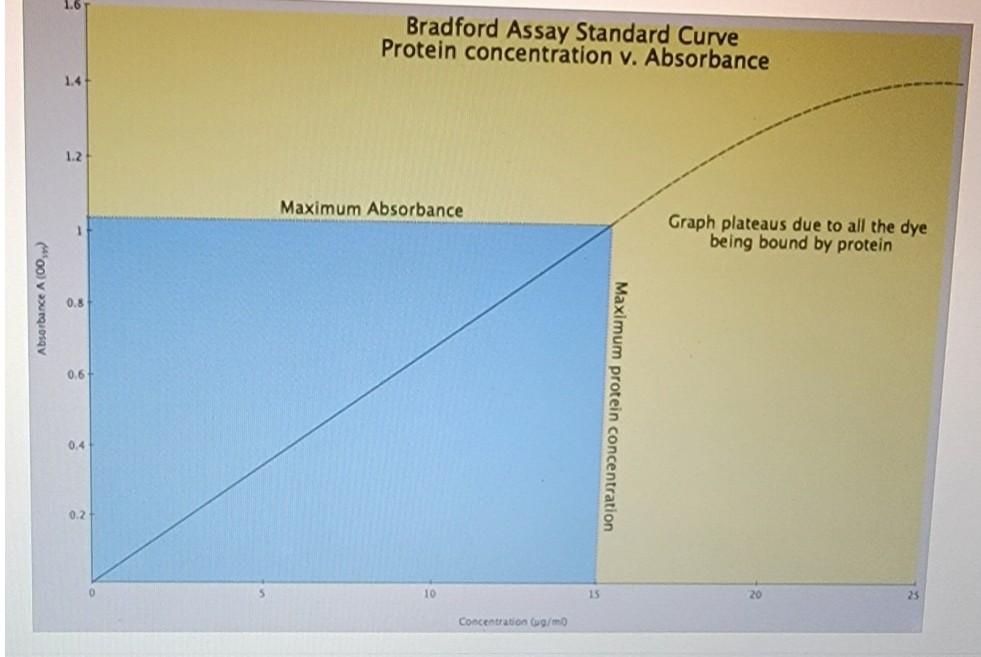
1. Use Logger Pro to generate a standard curve for the BSA standards that you measured in the spectrophotometer. First plot concentration vs. absorbance. Then insert a trend line (linear regression line) to form the standard curve. Paste in a labeled copy of your graph as a figure here in your answer and write an appropriate descriptive legend below it (Figure 1). Description - see: Writing Papers in the Biological Sciences for good examples of legend writing. 2. Record the equation for the regression line. What do the different values in the equation represent? 3. What are the concentrations of the 2 unknown hemoglobin samples that you measured in lab? Use (and show your work) the regression line equation to calculate the concentration of the unknown solution. Below is the absorption spectra for Coomassie Blue - the dye involved in the Bradford Assay. 1.0 0.8 0.6 - Absorbance Absorption spectra 0.4 - for Coomassie Blue 0.2 - The Bradford assay has limits, it does not work for all protein concentrations. The assay is an indirect (or colorimetric) method for estimating protein concentrations. The Bradford assay is based on a shift in the absorbance of the dye, Coomassie Brilliant Blue G-250, from 465 nm to 595 nm when it binds a protein under acidic conditions. That is, the Bradford assay is really measuring the amount of bound dye and NOT the amount of protein present (although the two are connected until the dye is all used). As the dye is limiting (i.e., you only put in a set amount), then you can reach a point when all the dye is bound, and no matter how much more protein you put in you will not see a change in absorbance. That is, you can increase the protein level to a point where available dye becomes exhausted so the graph would plateau. This concept is illustrated by the graph below: 16 Bradford Assay Standard Curve Protein concentration v. Absorbance 1.4 12 Maximum Absorbance Graph plateaus due to all the dye being bound by protein sorbance A 100 0.8 Maximur 1.0 Bradford Assay Standard Curve Protein concentration v. Absorbance 1.4 1.2+ Maximum Absorbance Graph plateaus due to all the dye being bound by protein Absorbance A (00) 0.8 0.61 Maximum protein concentration 0.4 0.2 10 15 Concentration / You are trying to determine the concentration of the protein Nettle that you have isolated by ammonium surate predpitation followed by size exclusion chromatography. In a Bradford Assay, you generate the following standard curve and regression equation: Ooms 12 2. 0.4 Regression Equation: y = 0.9429x + 0.1196 8 : 0 0.5 2 Concentration (mg/ml) You make two versions of the Nettie protein to measure via the Bradford Assuy. The first, is an undiluted protein sample the second is a 1:20 dilution, made by adding 100u of original Nettie protein to 9001 of visulled water. The OD95 of the undiluted protein is 1.673 The ODof a 1:10 dilution of your protein is 0.875 I First decide wliides of these two data points to use (1.673 or 0.825, or undituted vidiluted then determine the correct concentration of Nettie protein 15ow your calculations if you want full credit
Step by Step Solution
There are 3 Steps involved in it
Step: 1

Get Instant Access to Expert-Tailored Solutions
See step-by-step solutions with expert insights and AI powered tools for academic success
Step: 2

Step: 3

Ace Your Homework with AI
Get the answers you need in no time with our AI-driven, step-by-step assistance
Get Started


