

Question
Hello, I need to make a script that will create a scatterplot using seaborn as sns. I already have a script that reads a fasta
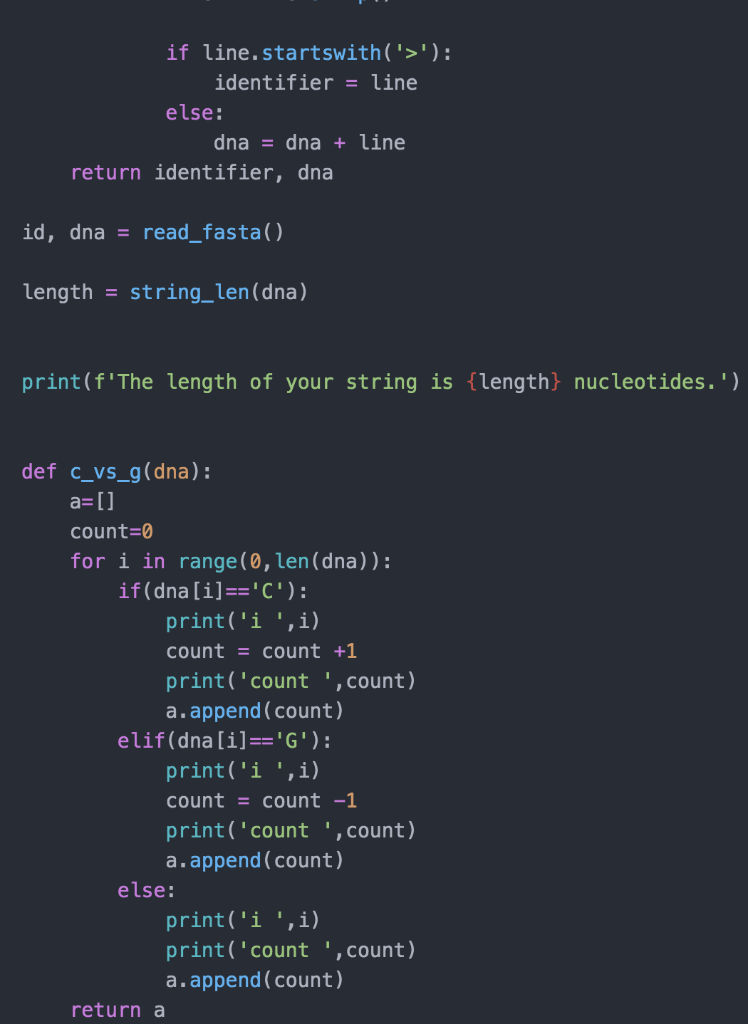
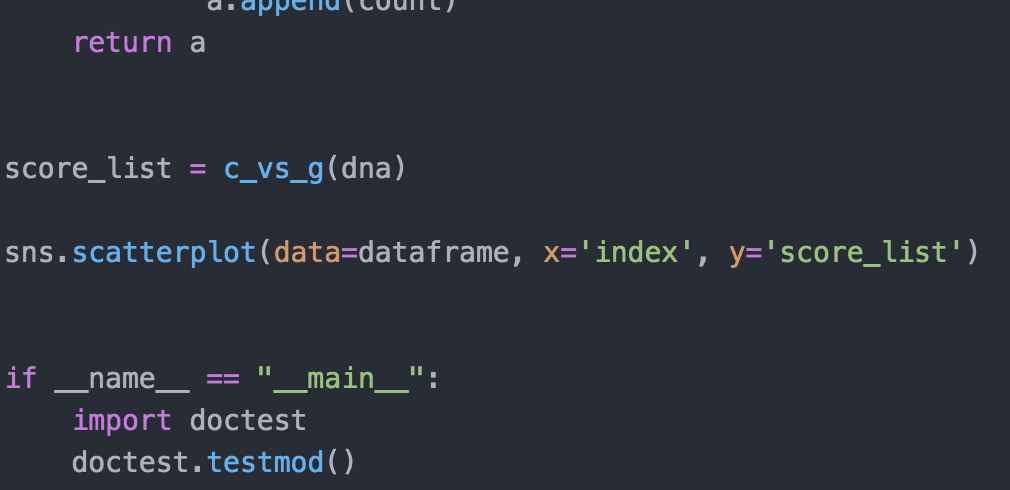
Hello, I need to make a script that will create a scatterplot using seaborn as sns. I already have a script that reads a fasta file and generates a C VS G score and gives me a list of integers. I need to make a graph that will use that given list of integers as a value on Y-AXIS. There are two ways this can be done, I can either write those integers to a file, then read the file for graphing, or graph straight away using the list of integers for the y-axis.
Can you please write a script where this works and creates a Scatterplot? I don't know what the x axis should be, maybe index position but I don't know exactly. I have attached my scripts that works, I just need to graph(scatterplot) the fasta file c vs g score it reads. 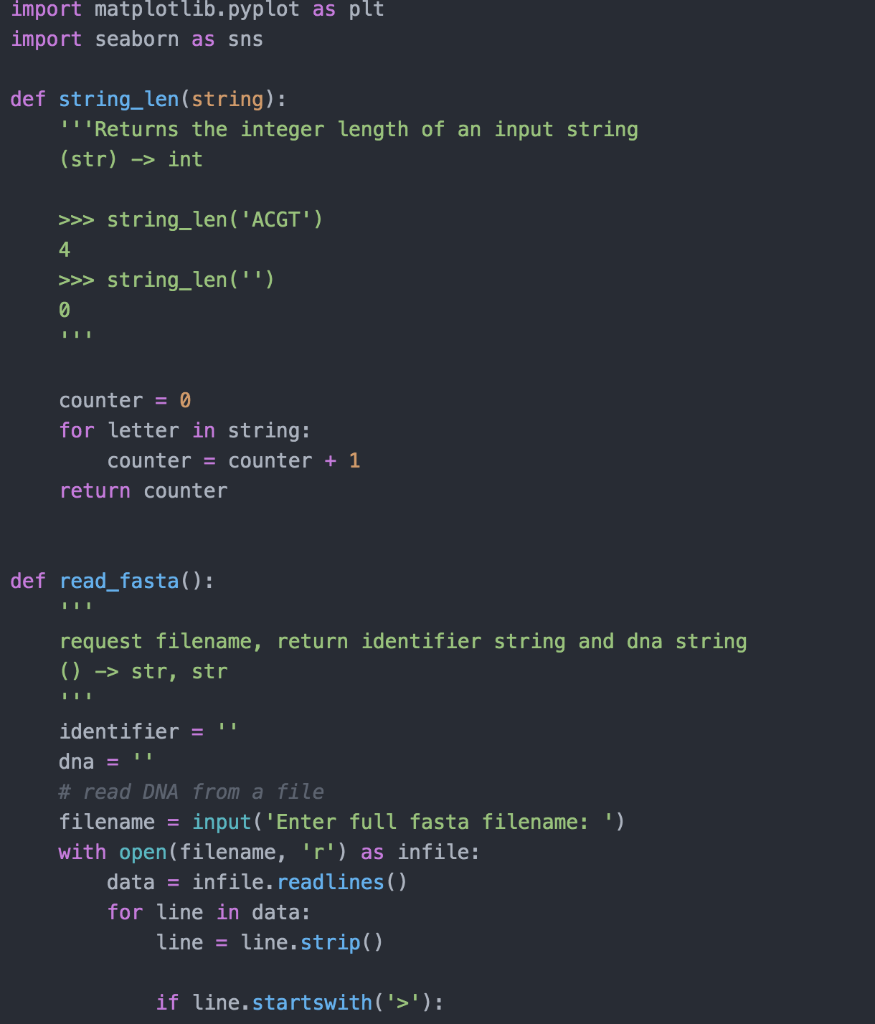
Step by Step Solution
There are 3 Steps involved in it
Step: 1

Get Instant Access to Expert-Tailored Solutions
See step-by-step solutions with expert insights and AI powered tools for academic success
Step: 2

Step: 3
Ace Your Homework with AI
Get the answers you need in no time with our AI-driven, step-by-step assistance
Get Started
SQL Instant Reference
Authors: Gruber, Martin Gruber
2nd Edition
0782125395, 9780782125399