Hello, I was wondering if my answers are correct? If not what am I doing wrong?
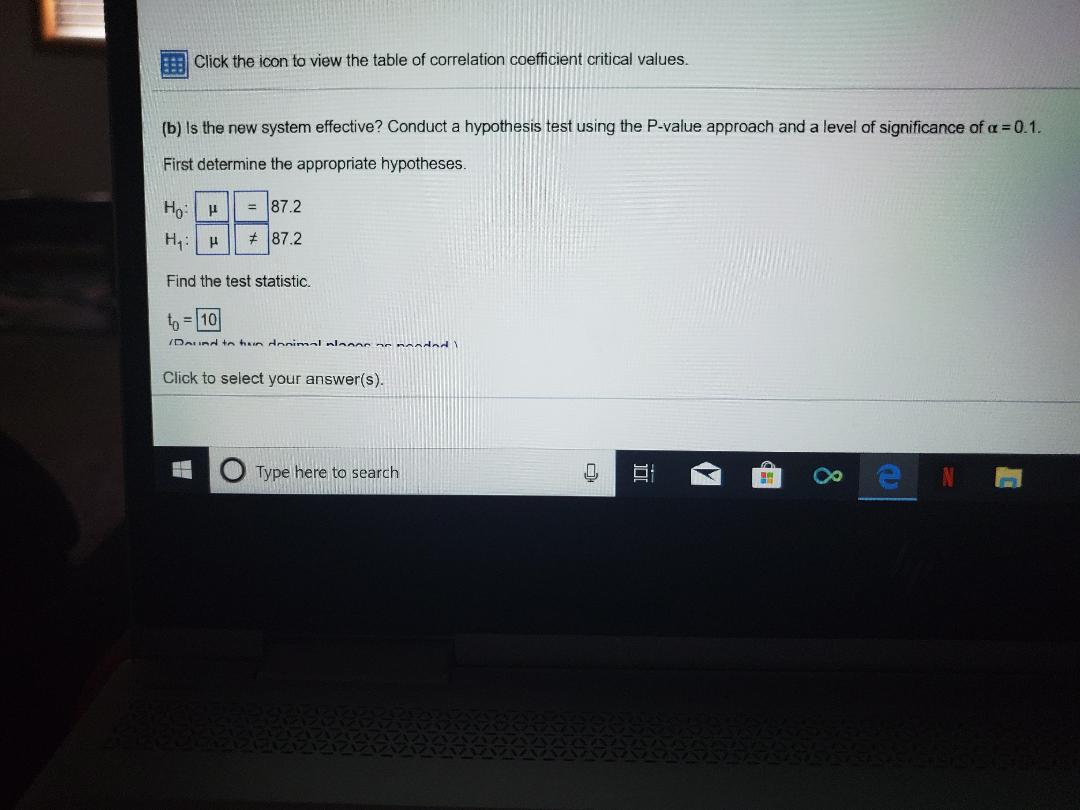
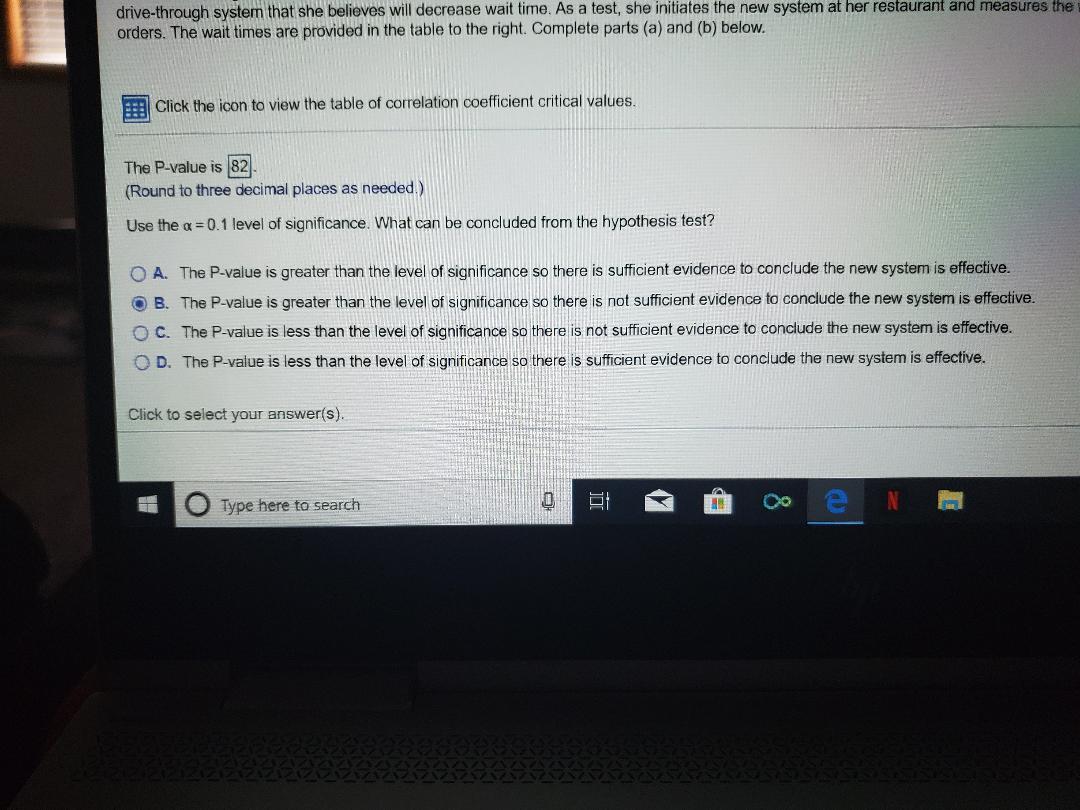
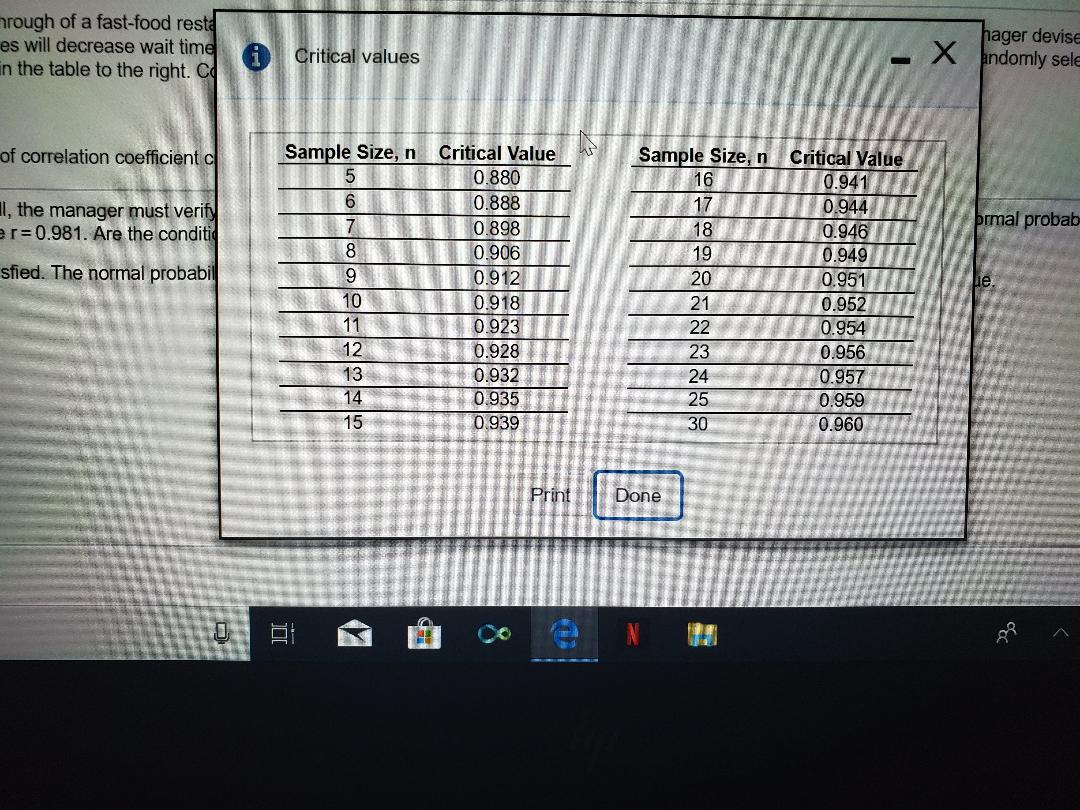
This Question: 10 pts 15 of 28 (24 complete) This Test: 280 pts possible Question Help The mean waiting time al the drive-through of a fast food restaurant from the lime an arder is placed to the time the order is received is 87 2 ssounds. A manager devises a new 108.2 drive-through system that she believes will decrease wait time. As a test, she initiates the new system at her restaurant and measures the wait time for 10 randomly selected 81.8 68:1 94.8 orders. The wait times are provided in the lable to the right. Complete parts (a) and (b) below. 56.6 87 1 75.6 69.2 67.2 81.4 Eff Click the ioan to view the table of correlation coefficient critical values. [a) Because the sample size is small, the manager must verify that the wail time is normally distributed and the sample does not contain any outliers. The normal probability plot is shown below and the sample correlation coefficient is known to be r= 0.351, Are the conditions for testing the hypothesis satisfied? Yes, | the conditions ) are satisfied. The normal probability plot | is linear enough, since the correlation coefficient is | less than the critical value. 2- Expected z-score Q 60 75 90 105 -1- -24 Click to select your answer(s) Type here to search N 2:21 PM 8/23/2019 2 E R T Y D F G H KClick the icon to view the table of correlation coefficient critical values. (b) Is the new system effective? Conduct a hypothesis test using the P-value approach and a level of significance of a = 0.1. First determine the appropriate hypotheses. Ho |87.2 Hy: H 87.2 Find the test statistic. to = 10 Darind to hun animal alone . Click to select your answer(s). Type here to search e N mdrive-through system that she believes will decrease wait time. As a test, she initiates the new system at her restaurant and measures the orders. The wait times are provided in the table to the right. Complete parts (a) and (b) below. Click the icon to view the table of correlation coefficient critical values. The P-value is 82 (Round to three decimal places as needed.) Use the a = 0.1 level of significance. What can be concluded from the hypothesis test? O A. The P-value is greater than the level of significance so there is sufficient evidence to conclude the new system is effective. Q B. The P-value is greater than the level of significance so there is not sufficient evidence to conclude the new system is effective. O C. The P-value is less than the level of significance so there is not sufficient evidence to conclude the new system is effective. O D. The P-value is less than the level of significance so there is sufficient evidence to conclude the new system is effective. Click to select your answer(s). Type here to search e Nrough of a fast-food rest es will decrease wait time X ager devise n the table to the right. Co Critical values andomly sele of correlation coefficient c Sample Size, n Critical Value Sample Size, n Critical Value 5 0.880 16 6 0.941 I, the manager must verify 0.888 17 0.944 r = 0.981. Are the conditio 7 0.898 18 0.946 ormal probab 8 0.906 19 sfied. The normal probabil 0.949 9 0.912 20 0.951 10 0.918 21 0.952 11 0.923 22 0.954 12 0.928 23 0.956 13 0.932 24 0.957 14 0.935 25 0.959 15 0.939 30 0.960 Print Done N


