Hello, May I get help with the questions in this lab, please? Radioactive Decay Lab. Below is the data table I already filled out Toss
Hello, May I get help with the questions in this lab, please?
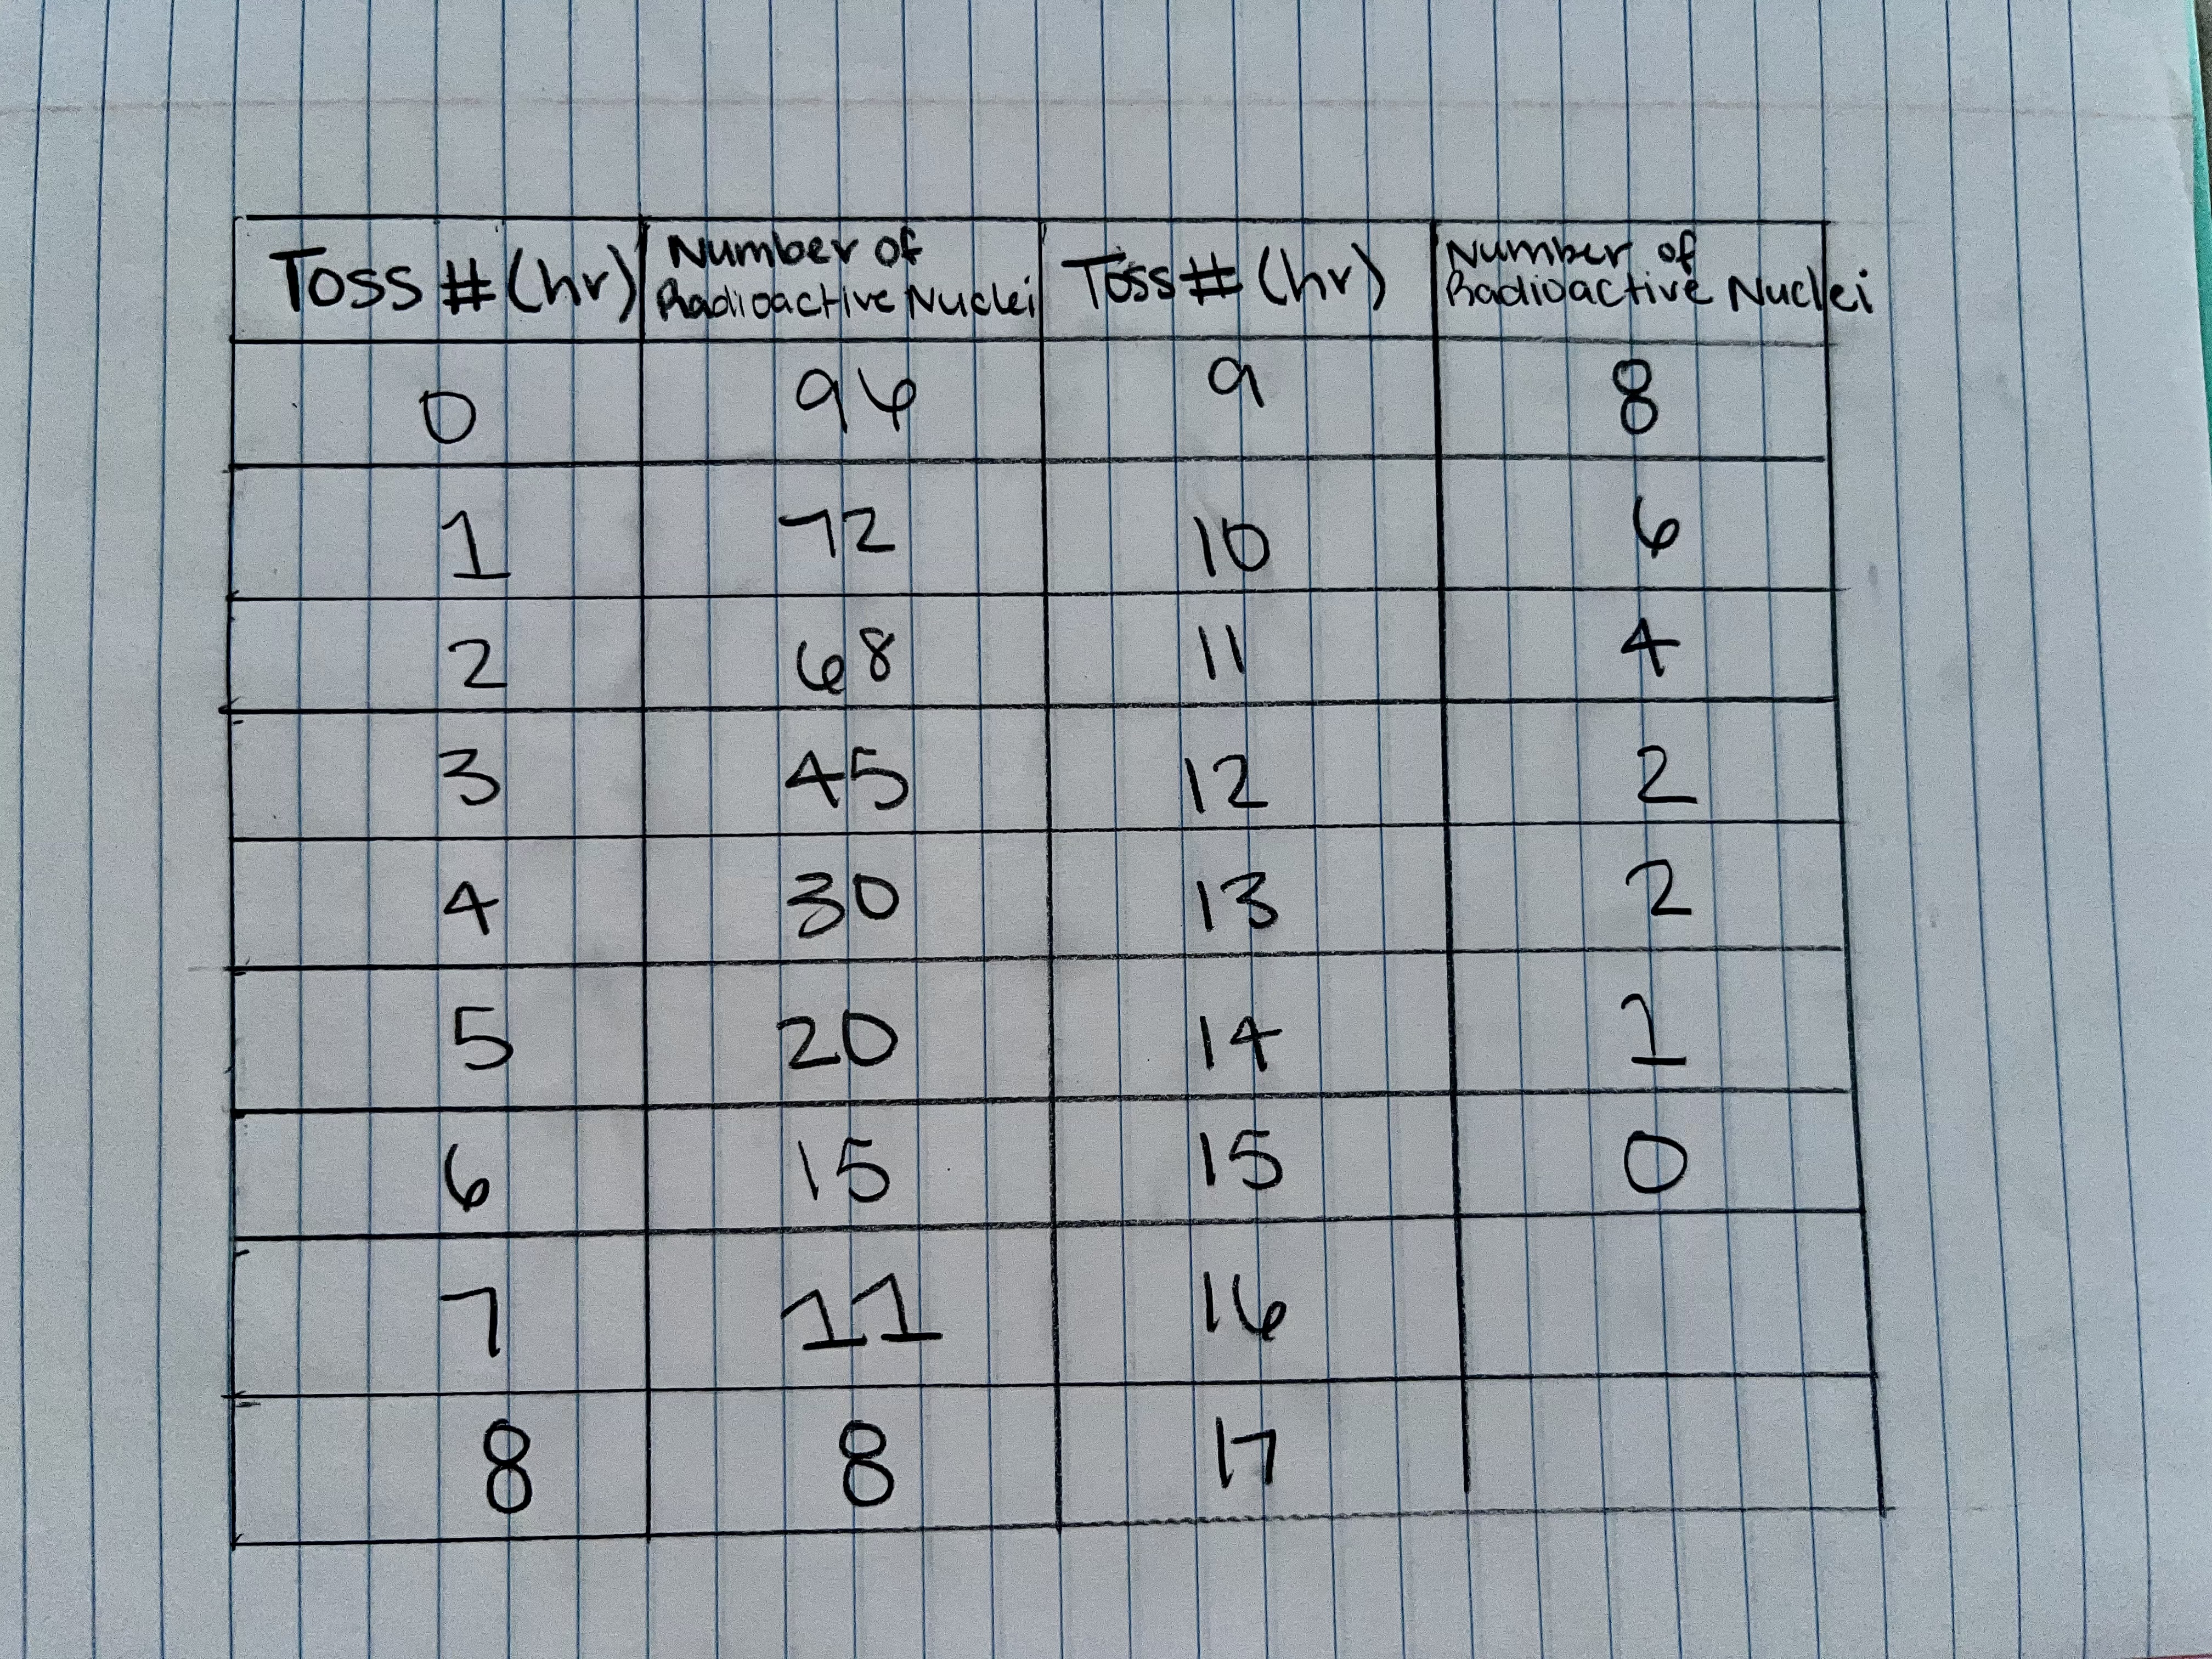
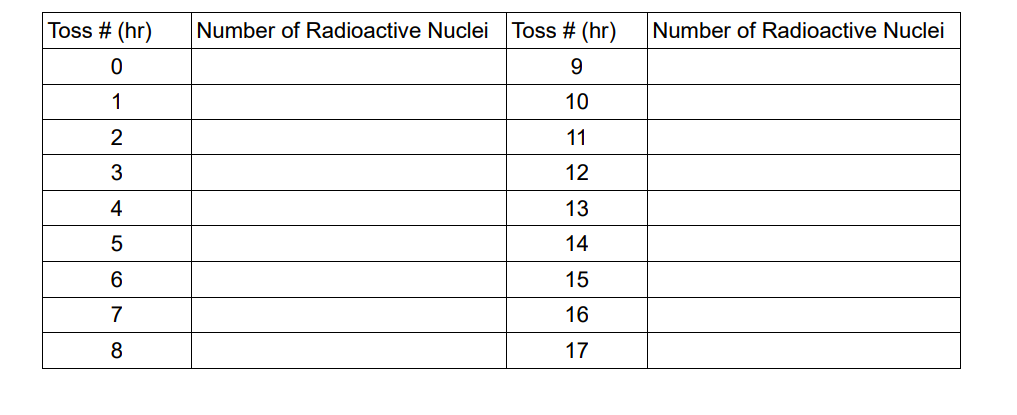
Radioactive Decay Lab. Below is the data table I already filled out
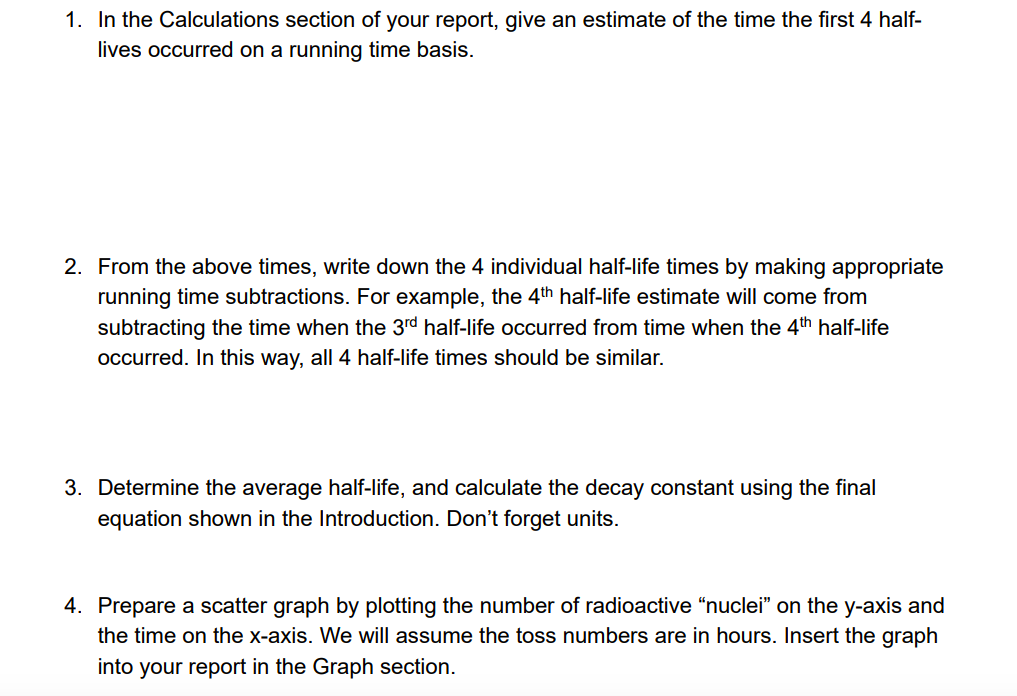
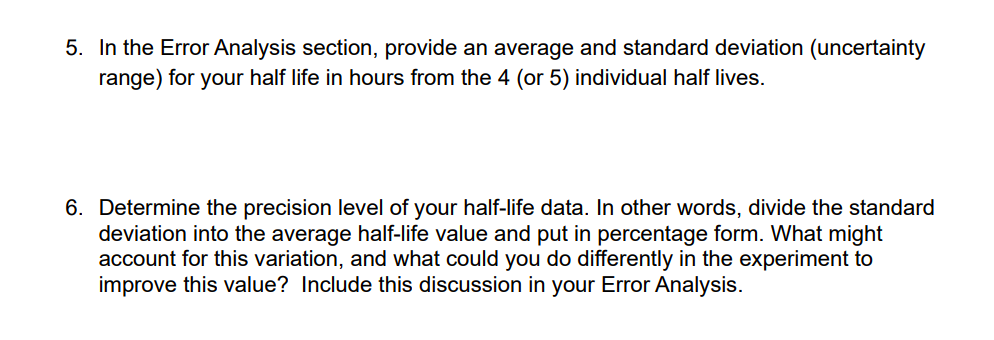
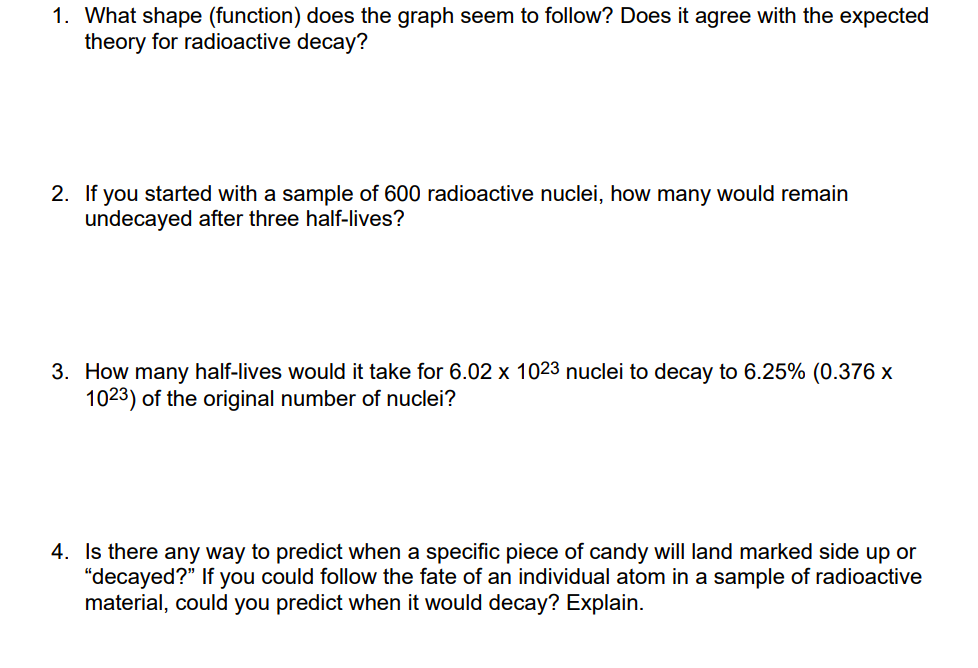
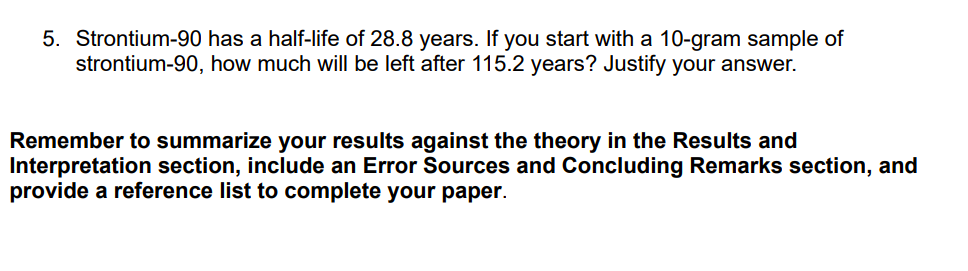
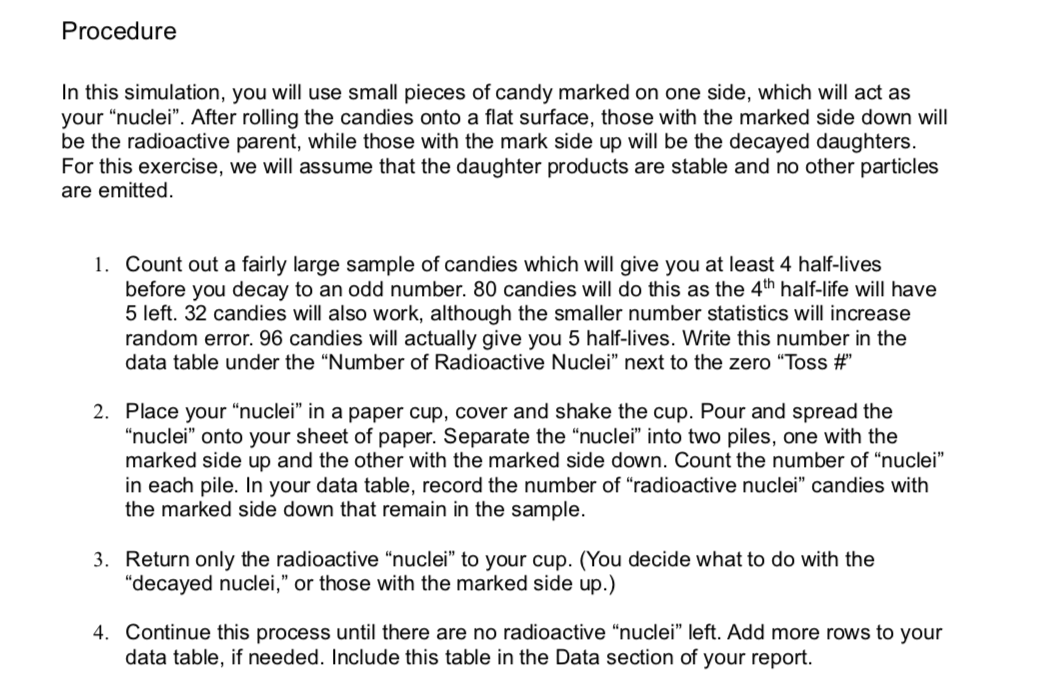
Toss # (hr) Number of Radioactive Nuclei/ Toss # (hr)) Number of Radioactive Nuclei -72 10 6 60 8 11 45 12 30 13 20 14 15 15 11 8 17Toss # (hr) Number of Radioactive Nuclei Toss # (hr) Number of Radioactive Nuclei 9 1O 11 12 13 0 1 2 3 4 5 14 15 16 17 1. In the Calculations section of your report, give an estimate of the time the rst 4 half- Iives occurred on a running time basis. From the above times, write down the 4 individual half-life times by making appropriate running time subtractions. For example, the 4'\" half-life estimate will come from subtracting the time when the 3rd half-life occurred from time when the 4'h half-life occurred. In this way, all 4 half-life times should be similar. Determine the average half-life, and calculate the decay constant using the nal equation shown in the Introduction. Don't forget units. Prepare a scatter graph by plotting the number of radioactive \"nuclei\" on the y-axis and the time on the xaxis. We will assume the toss numbers are in hours. Insert the graph into your report in the Graph section. 5. In the Error Analysis section, provide an average and standard deviation (uncertainty range) for your half life in hours from the 4 (or 5) individual half lives. 6. Determine the precision level of your half-life data. In other words, divide the standard deviation into the average half-life value and put in percentage form. What might account for this variation, and what could you do differently in the experiment to improve this value? Include this discussion in your Error Analysis. 1. What shape (function) does the graph seem to follow? Does it agree with the expected theory for radioactive decay? 2. If you started with a sample of 600 radioactive nuclei, how many would remain undecayed after three half-lives? 3. How many half-lives would it take for 6.02 x 10²³ nuclei to decay to 6.25% (0.376 x 10²³) of the original number of nuclei? 4. Is there any way to predict when a specic piece of candy will land marked side up or "decayed?" If you could follow the fate of an individual atom in a sample of radioactive material, could you predict when it would decay? Explain. 5. Strontium-90 has a half-life of 28.8 years. If you start with a 10-gram sample of strontium-90, how much will be left after 115.2 years? Justify your answer. Remember to summarize your results against the theory in the Results and Interpretation section, include an Error Sources and Concluding Remarks section, and provide a reference list to complete your paper. Procedure In this simulation. you will use small pieces of candy marked on one side. which will act as your "nuclei". After rolling the candies onto a at surface, those with the marked side down will be the radioactive parent. while those with the mark side up will be the decayed daughters. For this exercise. we will assume that the daughter products are stable and no other particles are emitted. 1. Count out a fairly large sample of candies which will give you at least 4 half-lives before you decay to an odd number. 80 candies will do this as the 4'\" half-life will have 5 left. 32 candies will also work. although the smaller number statistics will increase random error. 96 candies will actually give you 5 half-lives. Write this number in the data table under the "Number of Radioactive Nuclei" next to the zero "Toss #" Place your "nuclei" in a paper cup. cover and shake the cup. Four and spread the \"nuclei" onto your sheet of paper. Separate the "nuclei" into two piles. one with the marked side up and the other with the marked side down. Count the number of "nuclei" in each pile. In your data table. record the number of "radioactive nuclei" candies with the marked side down that remain in the sample. . Return only the radioactive "nuclei" to your cup. (You decide what to do with the \"decayed nuclei." or those with the marked side up.) Continue this process until there are no radioactive "nuclei" left. Add more rows to your data table. if needed. Include this table in the Data section of your report
Step by Step Solution
There are 3 Steps involved in it
Step: 1
Get Instant Access to Expert-Tailored Solutions
See step-by-step solutions with expert insights and AI powered tools for academic success
Step: 2
Step: 3
Ace Your Homework with AI
Get the answers you need in no time with our AI-driven, step-by-step assistance