Hello, please answer this. Thank you
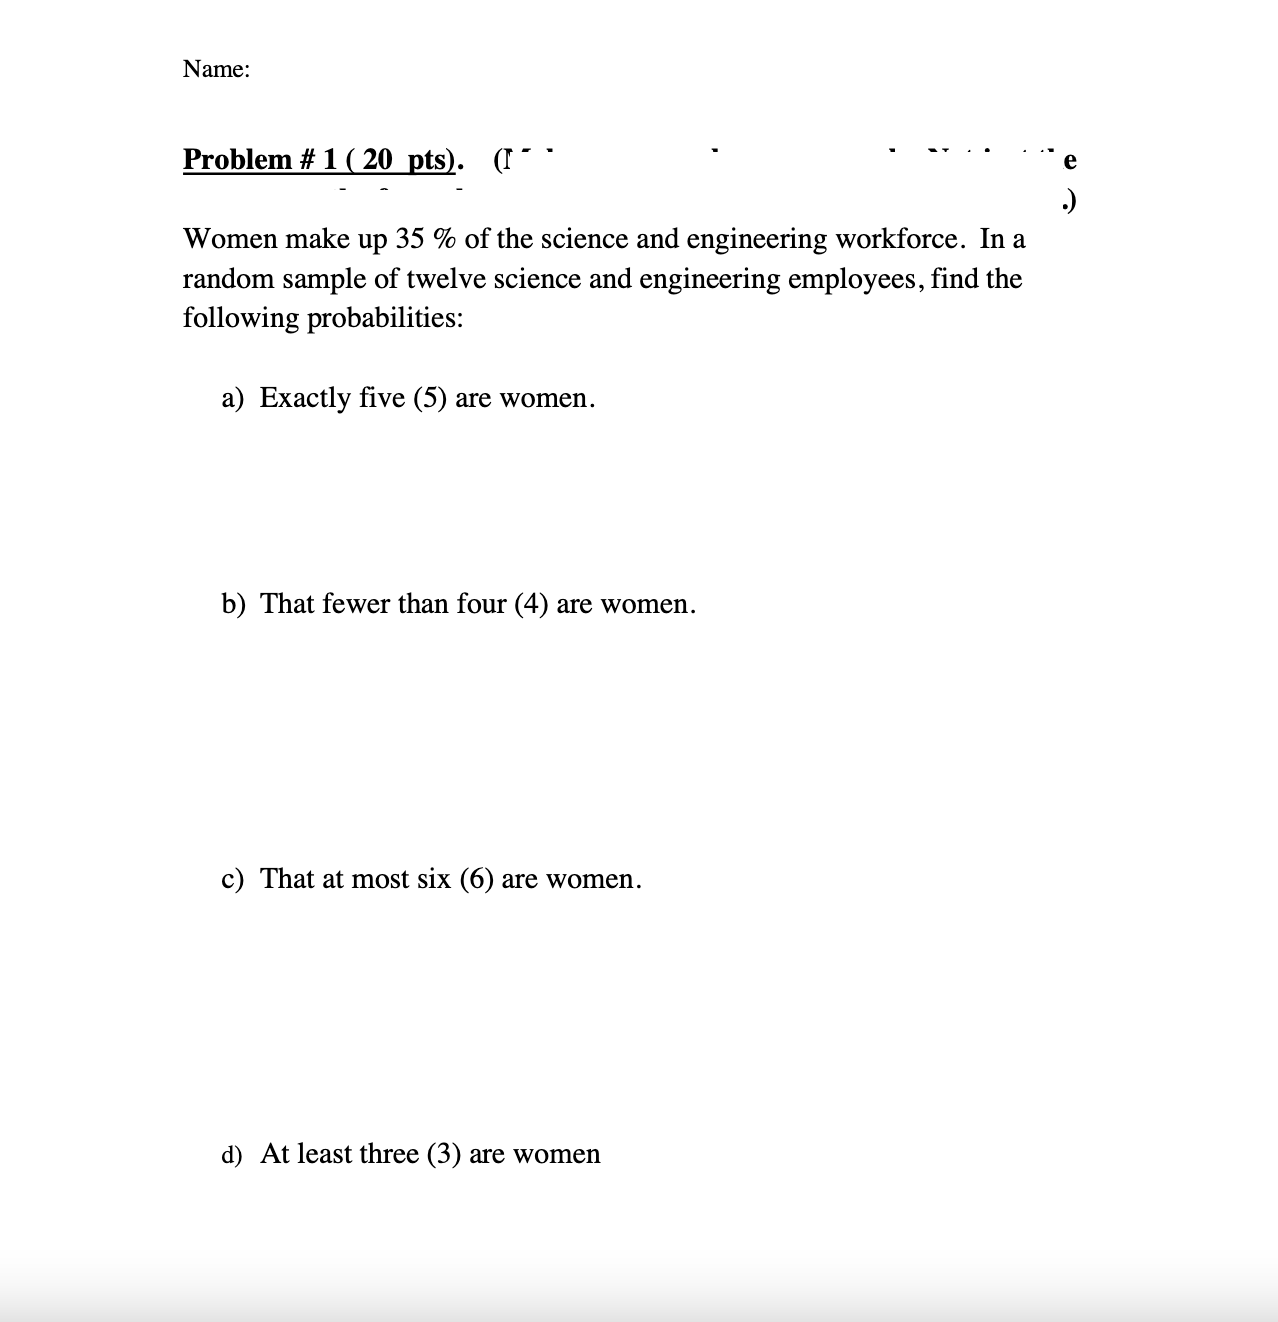
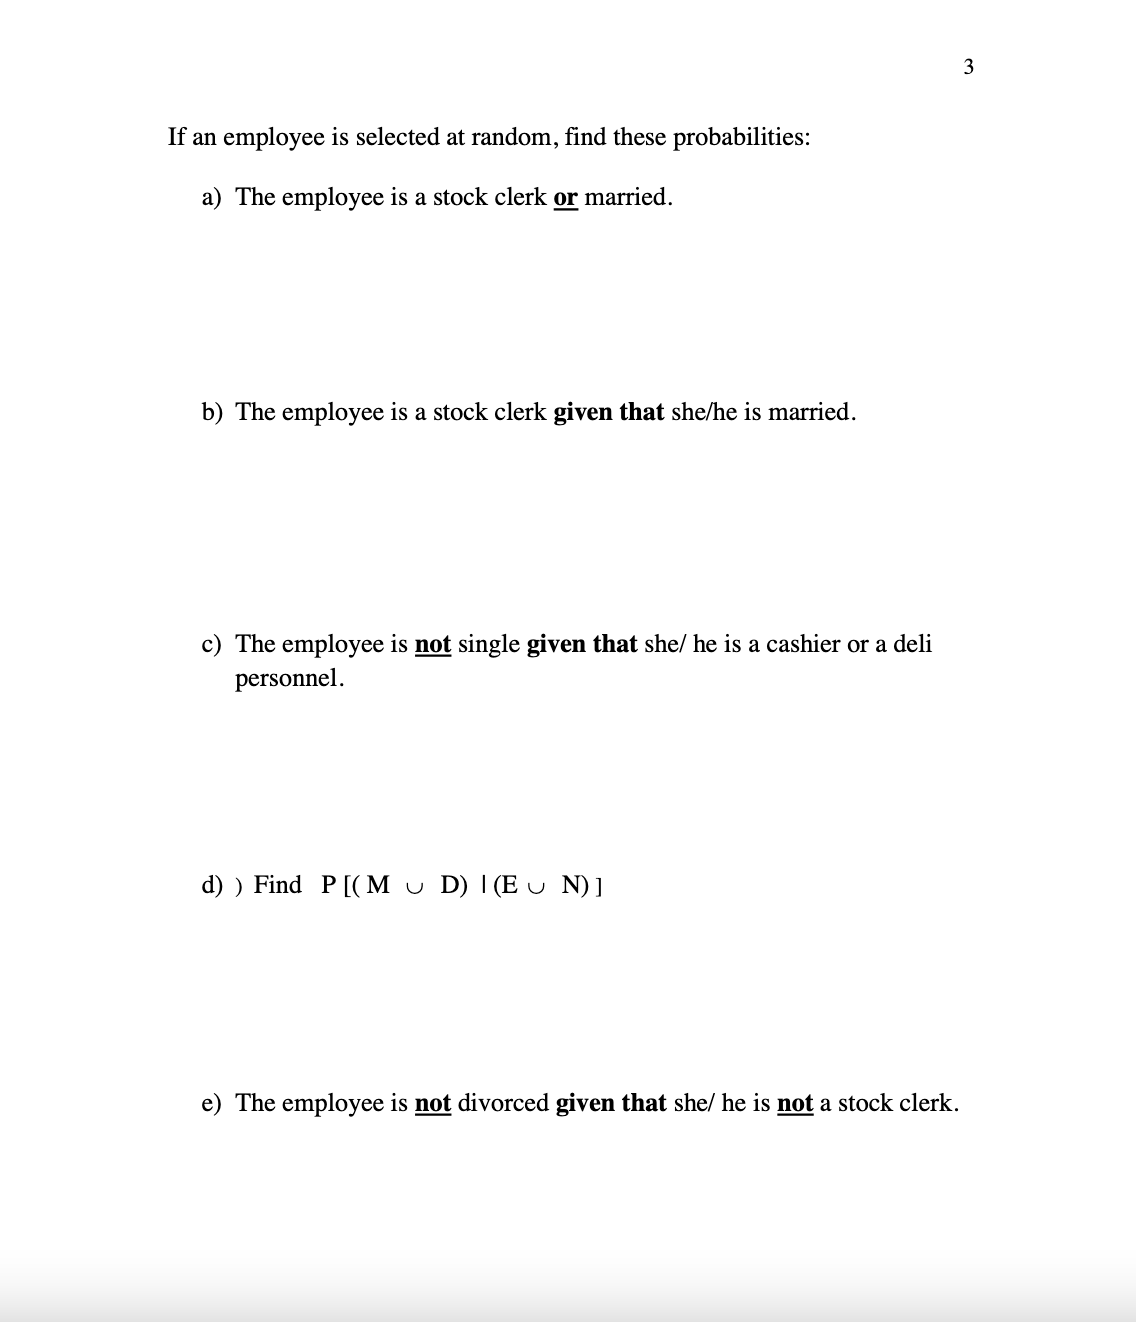
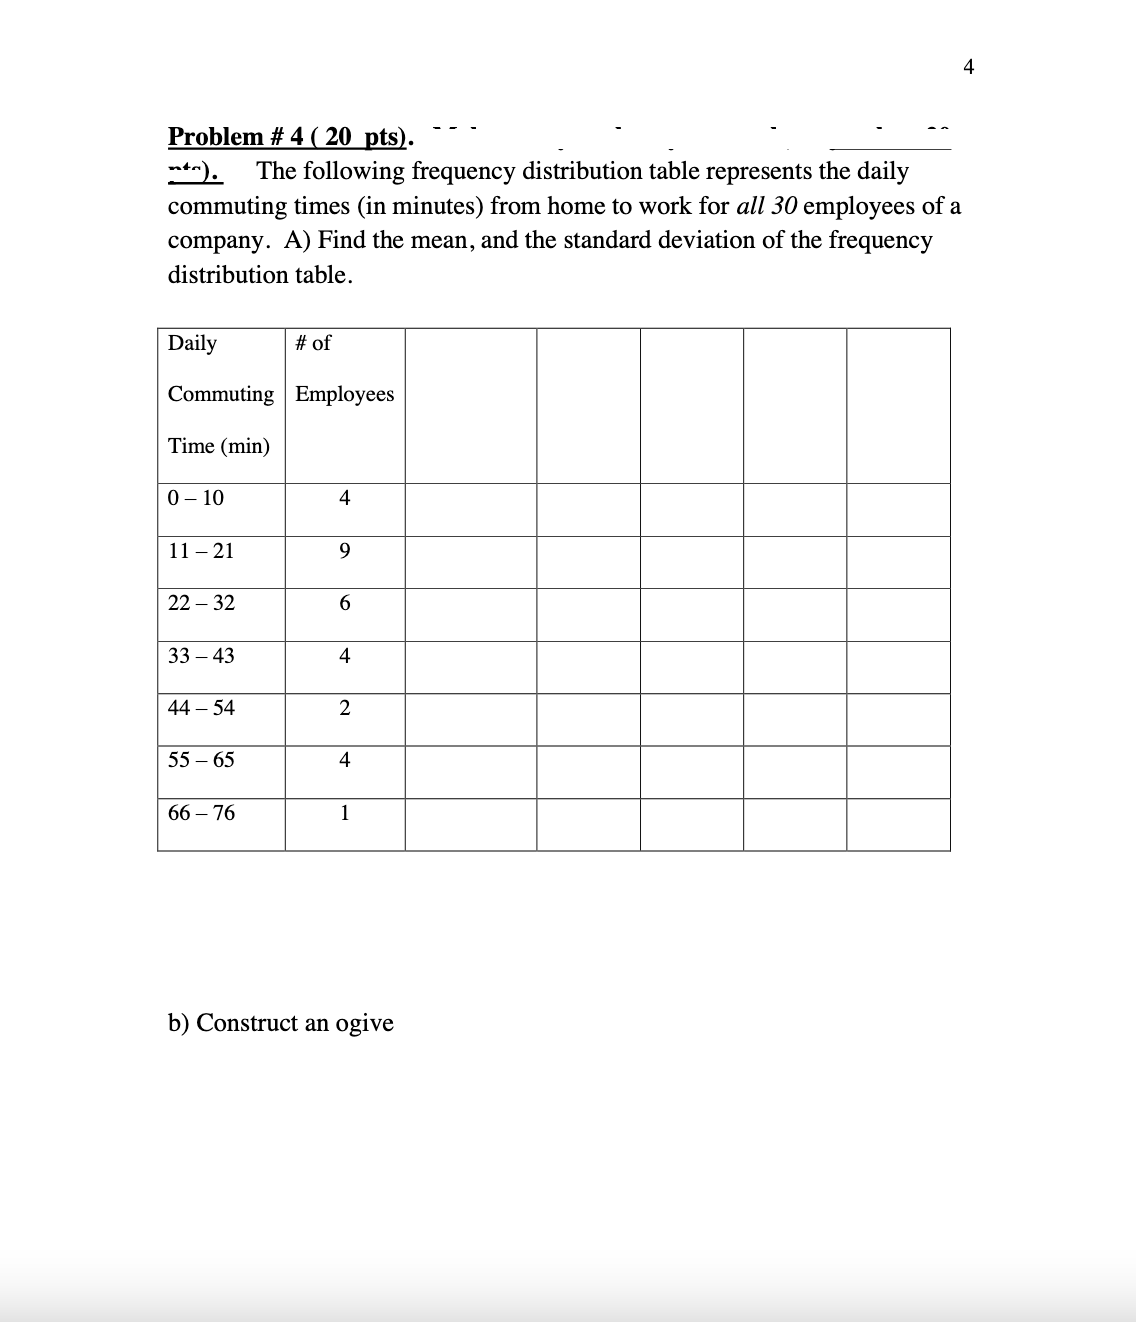
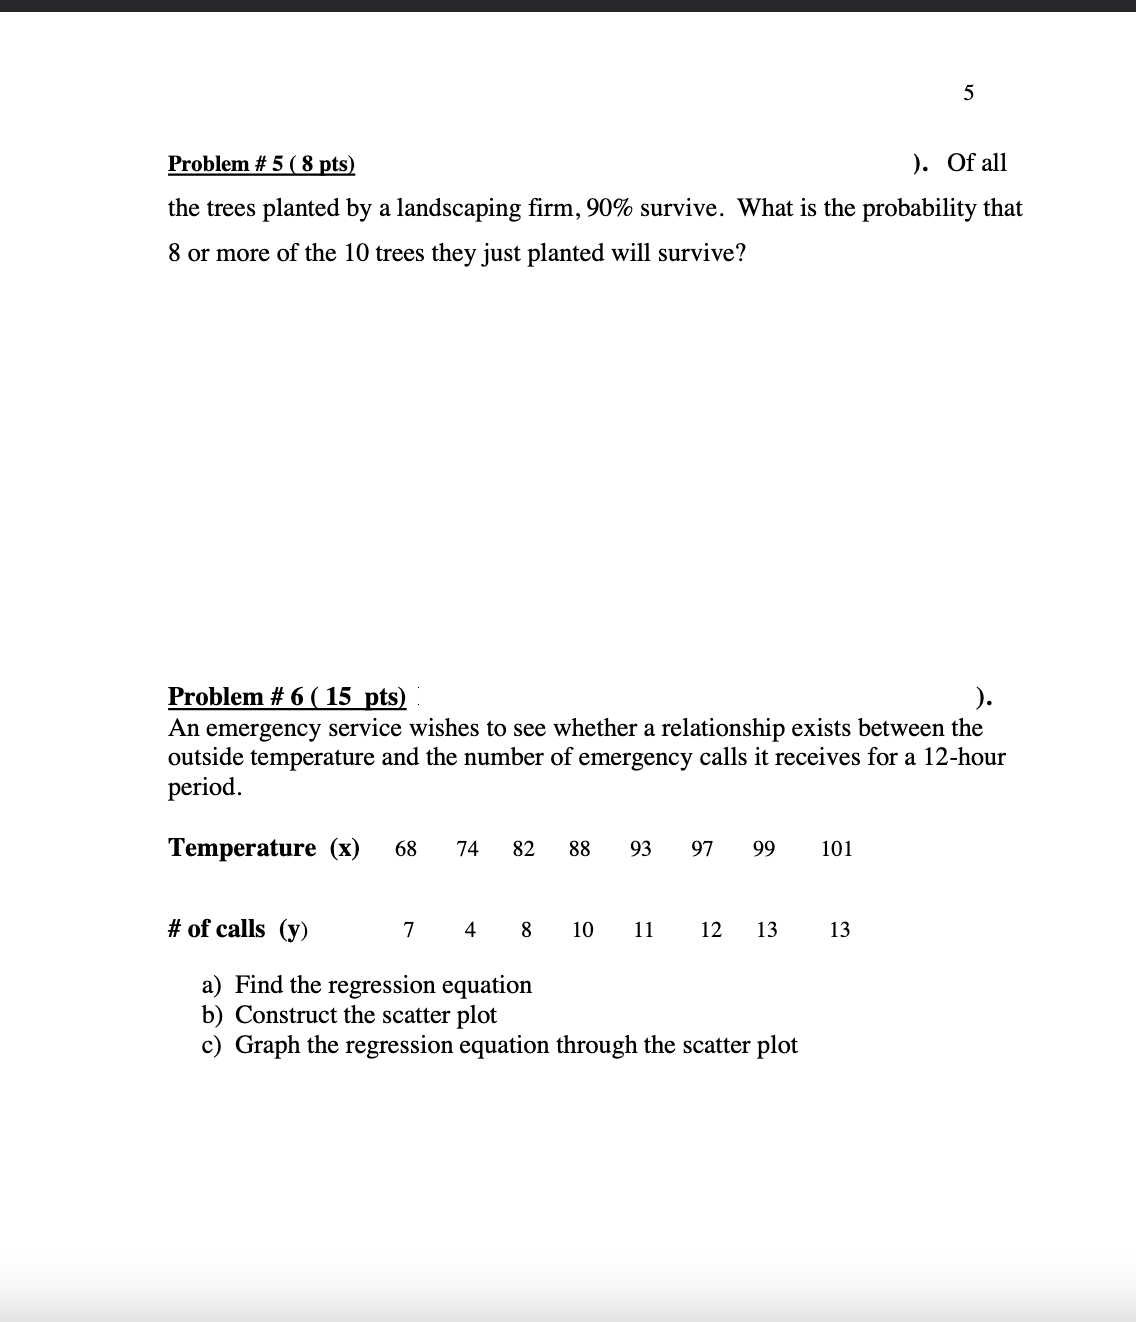
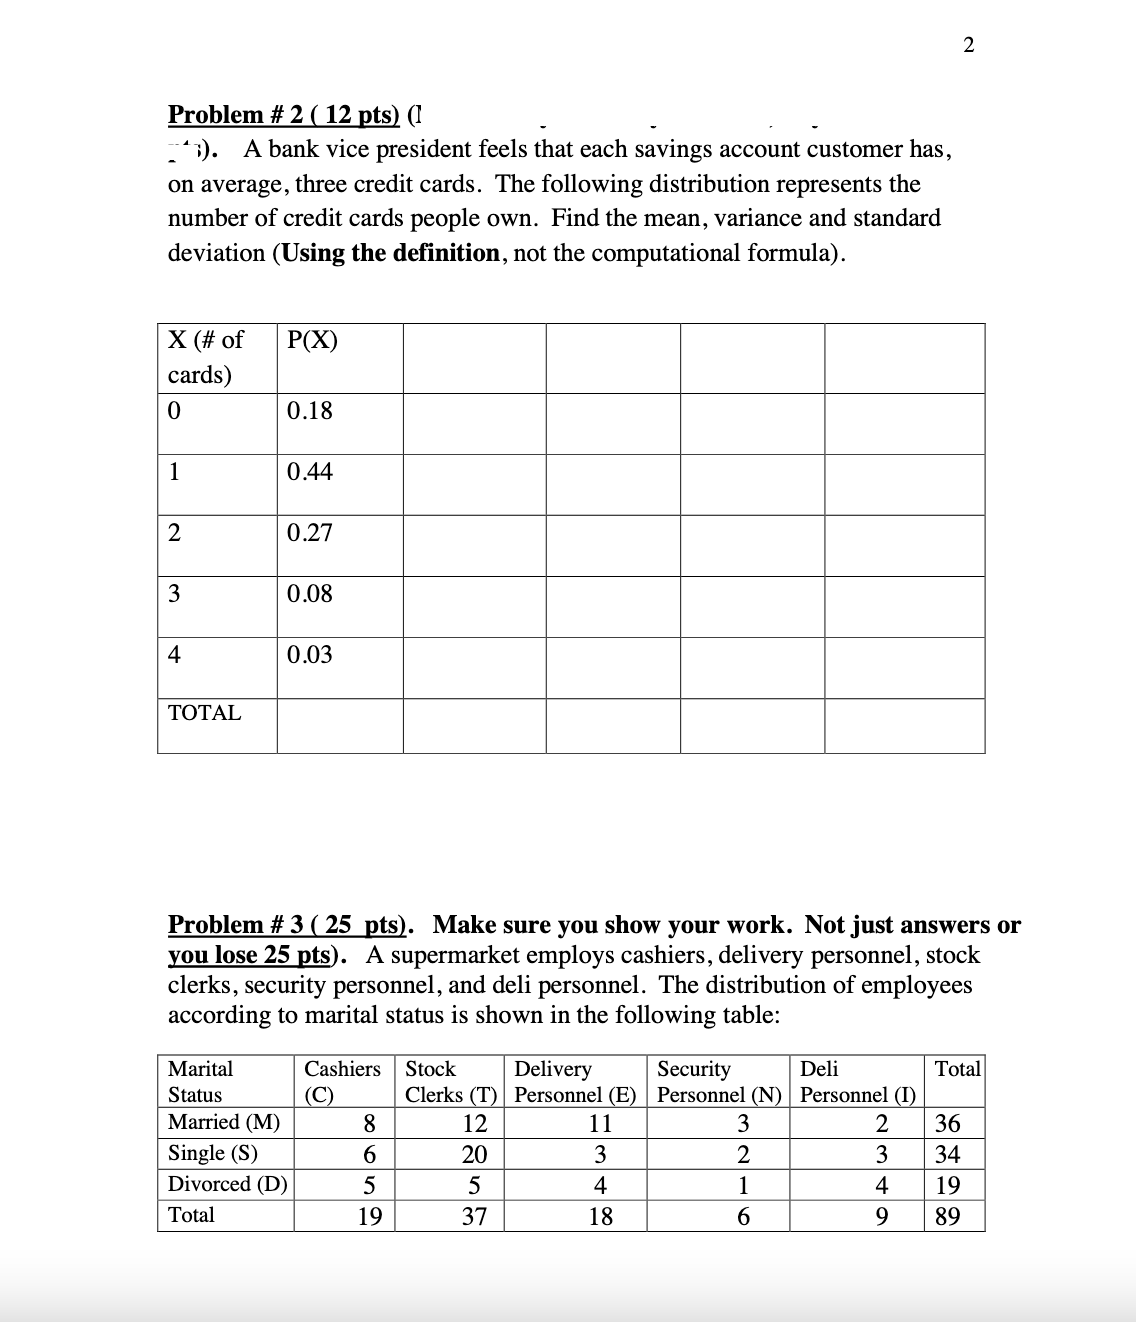
Name: Problem # 1 ( 20 pts). Women make up 35 % of the science and engineering workforce. In a random sample of twelve science and engineering employees, find the following probabilities: a) Exactly five (5) are women. b) That fewer than four (4) are women. c) That at most six (6) are women. d) At least three (3) are women3 If an employee is selected at random, find these probabilities: a) The employee is a stock clerk or married. b) The employee is a stock clerk given that she/he is married. c) The employee is not single given that she/ he is a cashier or a deli personnel. d) ) Find P[(M U D) I (E J N) ] e) The employee is not divorced given that she/ he is not a stock clerk.Problem#4[20 Etsl- "' - - _ -_ 4 n The following frequency distribution table represents the daily commuting times (in minutes) fmm home to work for all 30 employees of a company. A) Find the mean, and the standard deviation of the frequency distribution table. b) Construct an ogive Problemitsgslgts! ). Of all the trees planted by a landscaping firm, 90% survive. What is the probability that 8 or more of the 10 trees they just planted will survive? Problem#6! 15 ts! Z ) An emergency service wishes to see whether a relationship exists between the outside temperature and the number of emergency calls it receives for a 12-hour period. Temperature (x) 68 74 82 88 93 97 99 101 #ofcalls (y) 7 4 3 10 11 12 13 13 3) Find the regression equation b) Construct the scatter plot c) Graph the regression equation through the scatter plot Problem # 2 ( 12 pts) (1 "). A bank vice president feels that each savings account customer has, on average, three credit cards. The following distribution represents the number of credit cards people own. Find the mean, variance and standard deviation (Using the definition, not the computational formula). X (# of P(X) cards) 0 0.18 1 0.44 2 0.27 3 0.08 4 0.03 TOTAL Problem # 3 ( 25 pts). Make sure you show your work. Not just answers or you lose 25 pts). A supermarket employs cashiers, delivery personnel, stock clerks, security personnel, and deli personnel. The distribution of employees according to marital status is shown in the following table: Marital Cashiers Stock Delivery Security Deli Total Status (C) Clerks (T) Personnel (E) Personnel (N) Personnel (I) Married (M) 8 12 11 3 36 WIN Single (S) 20 3 IN 34 Divorced (D) 5 5 4 1 4 19 Total 19 37 18 6 9 89
