hello!! please help me with #'s 1, 2, 5, 6, 7, 9, 10 and 12!!
All of the information is included with the data tables and stuff!! please please help
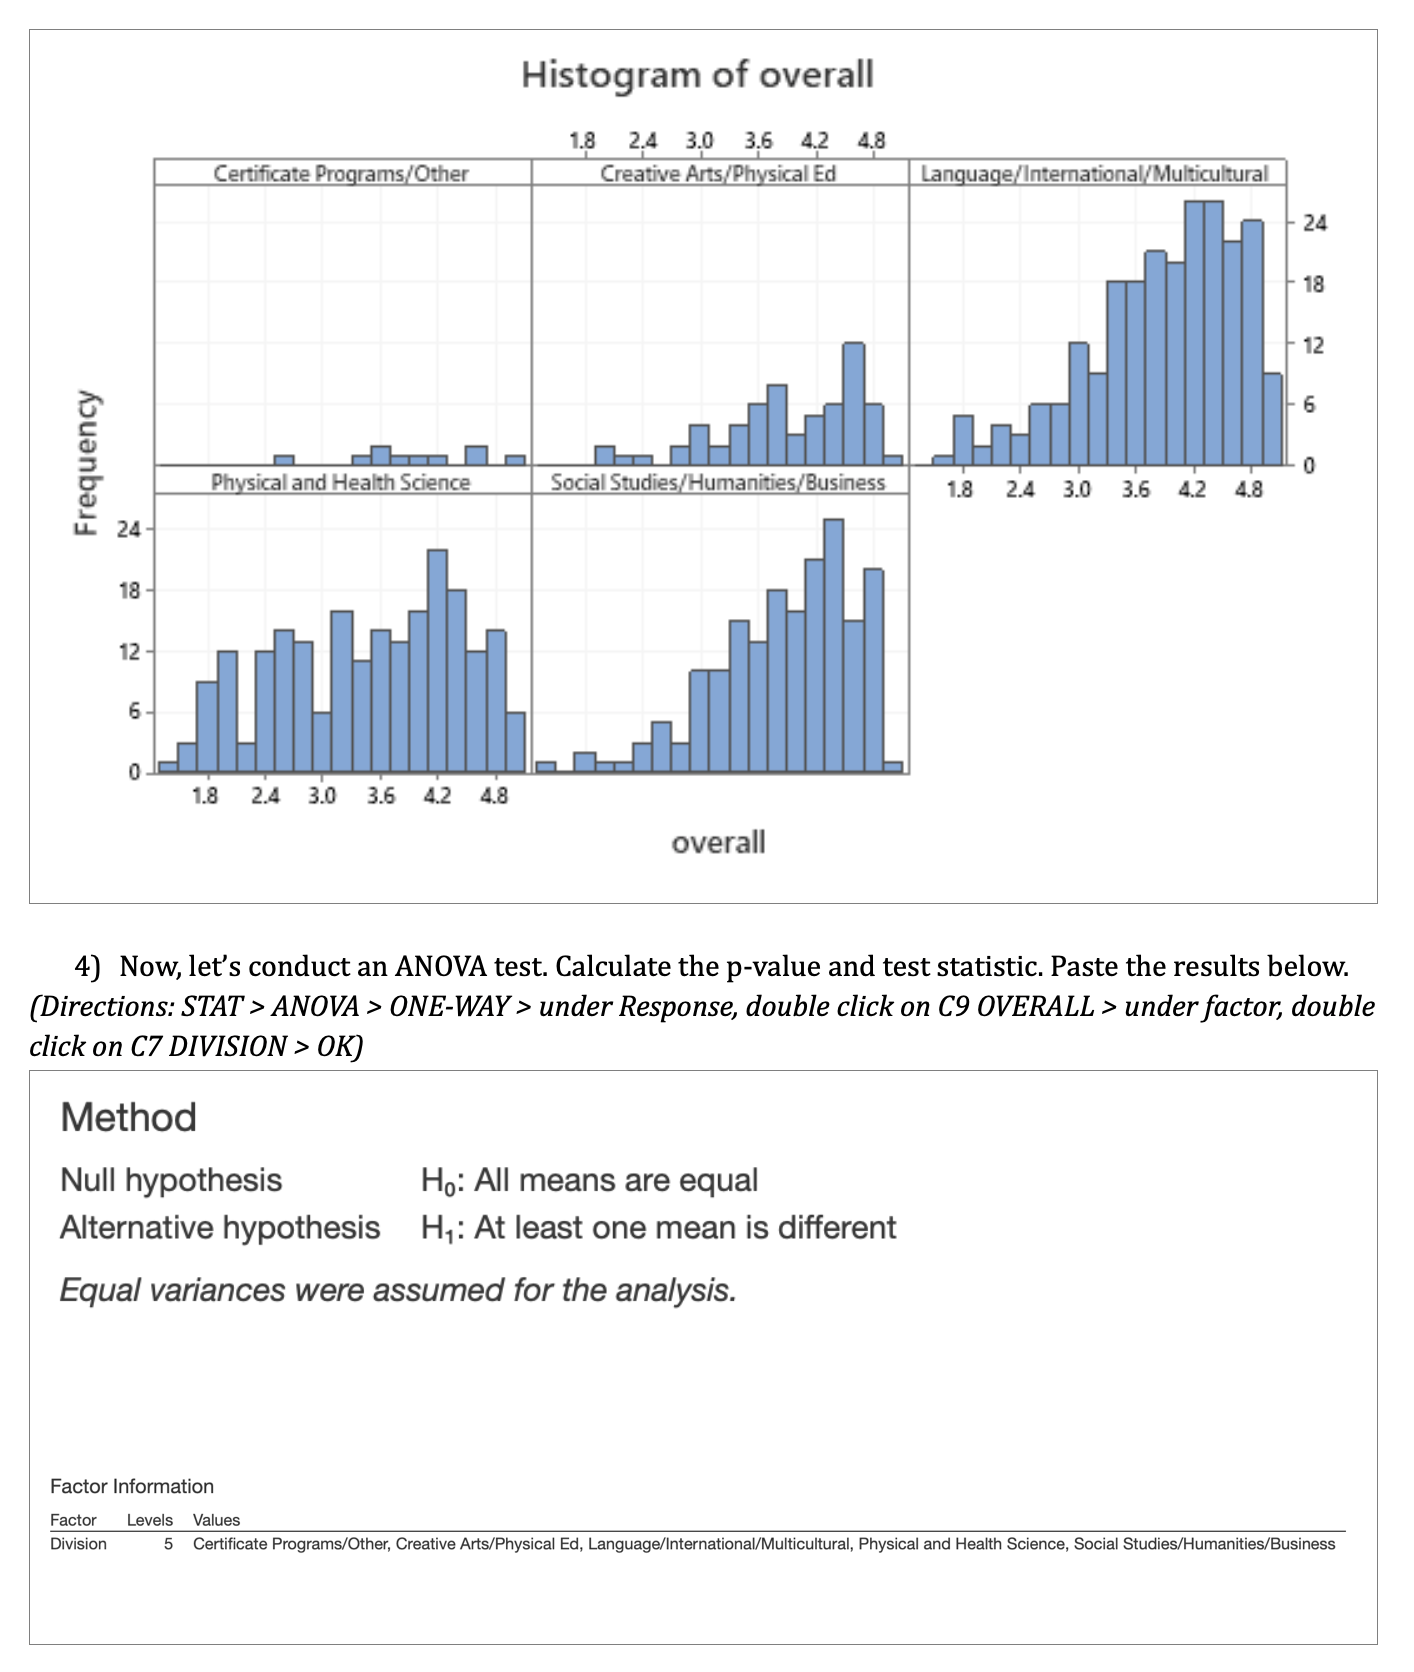
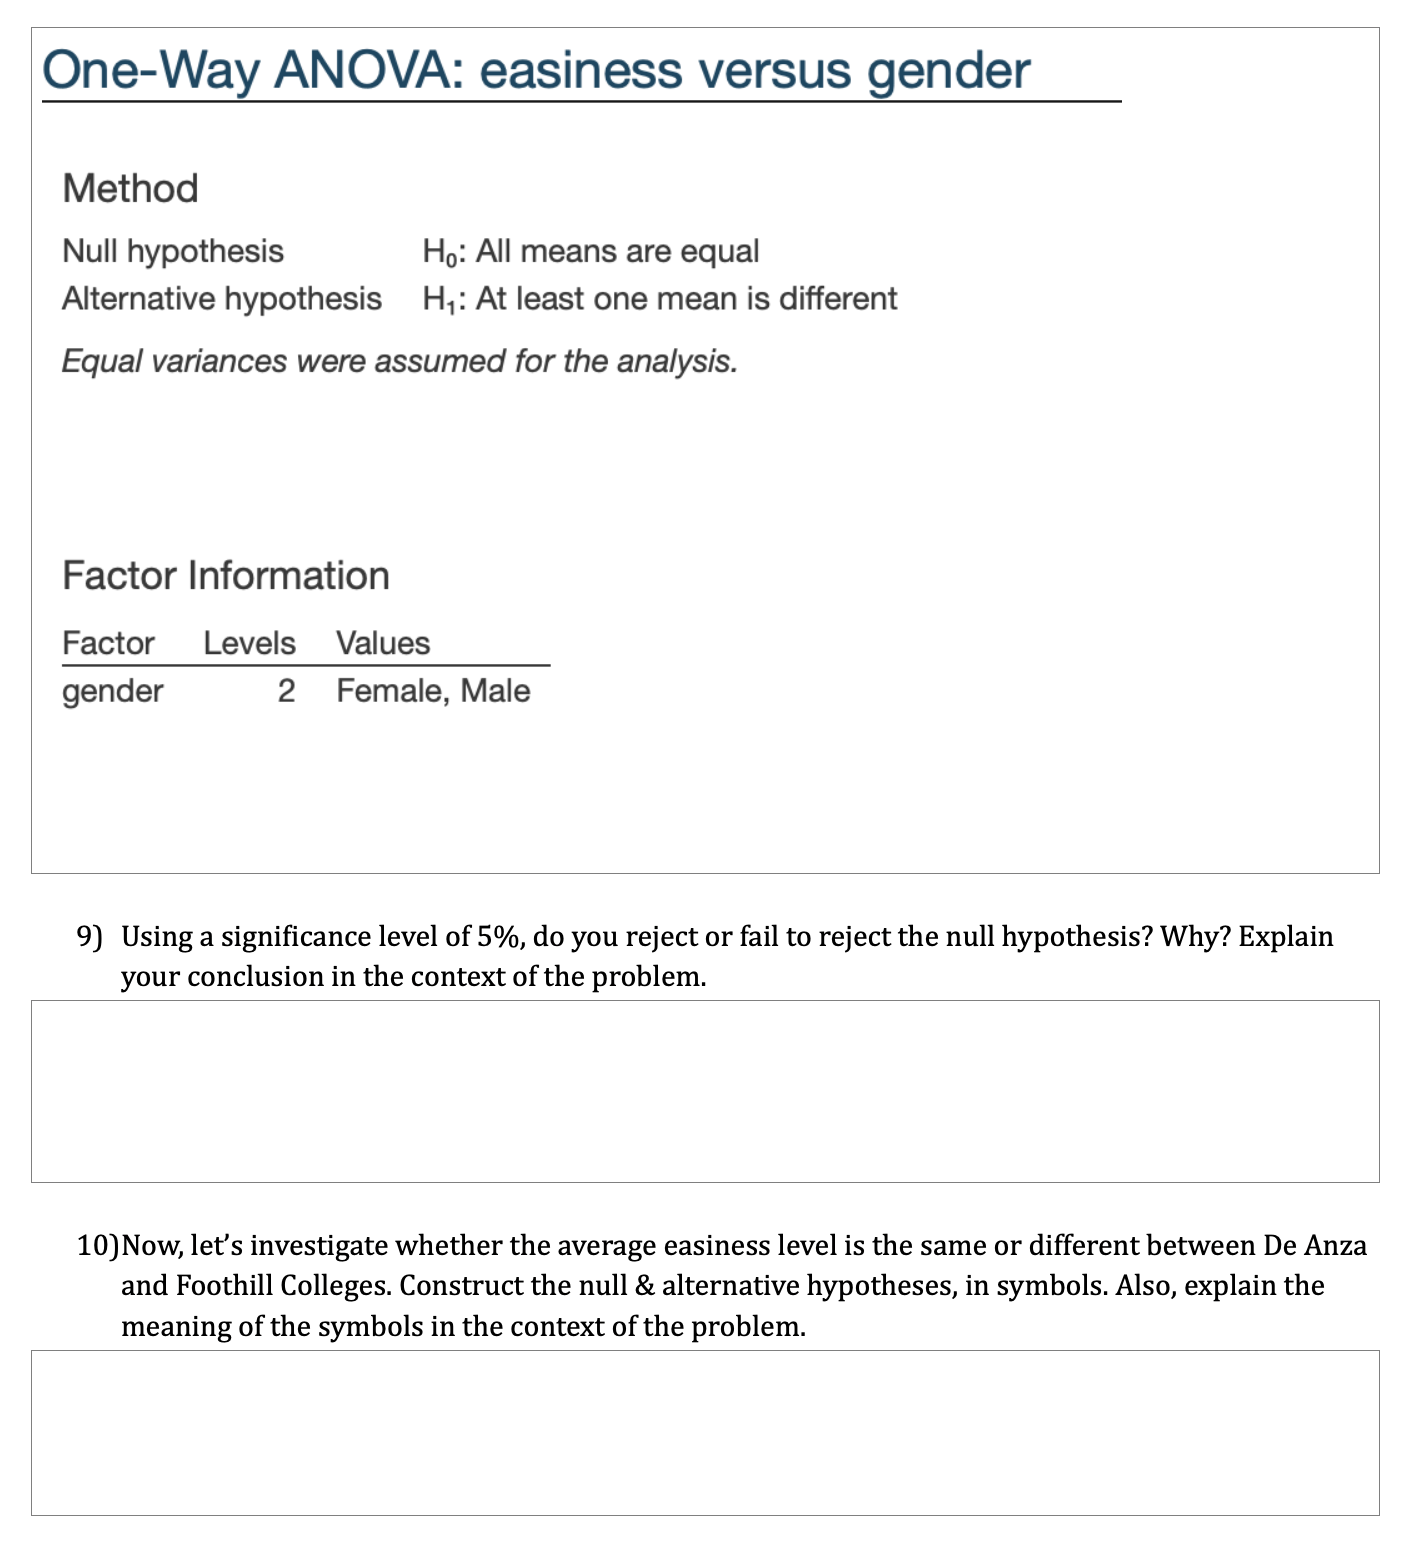
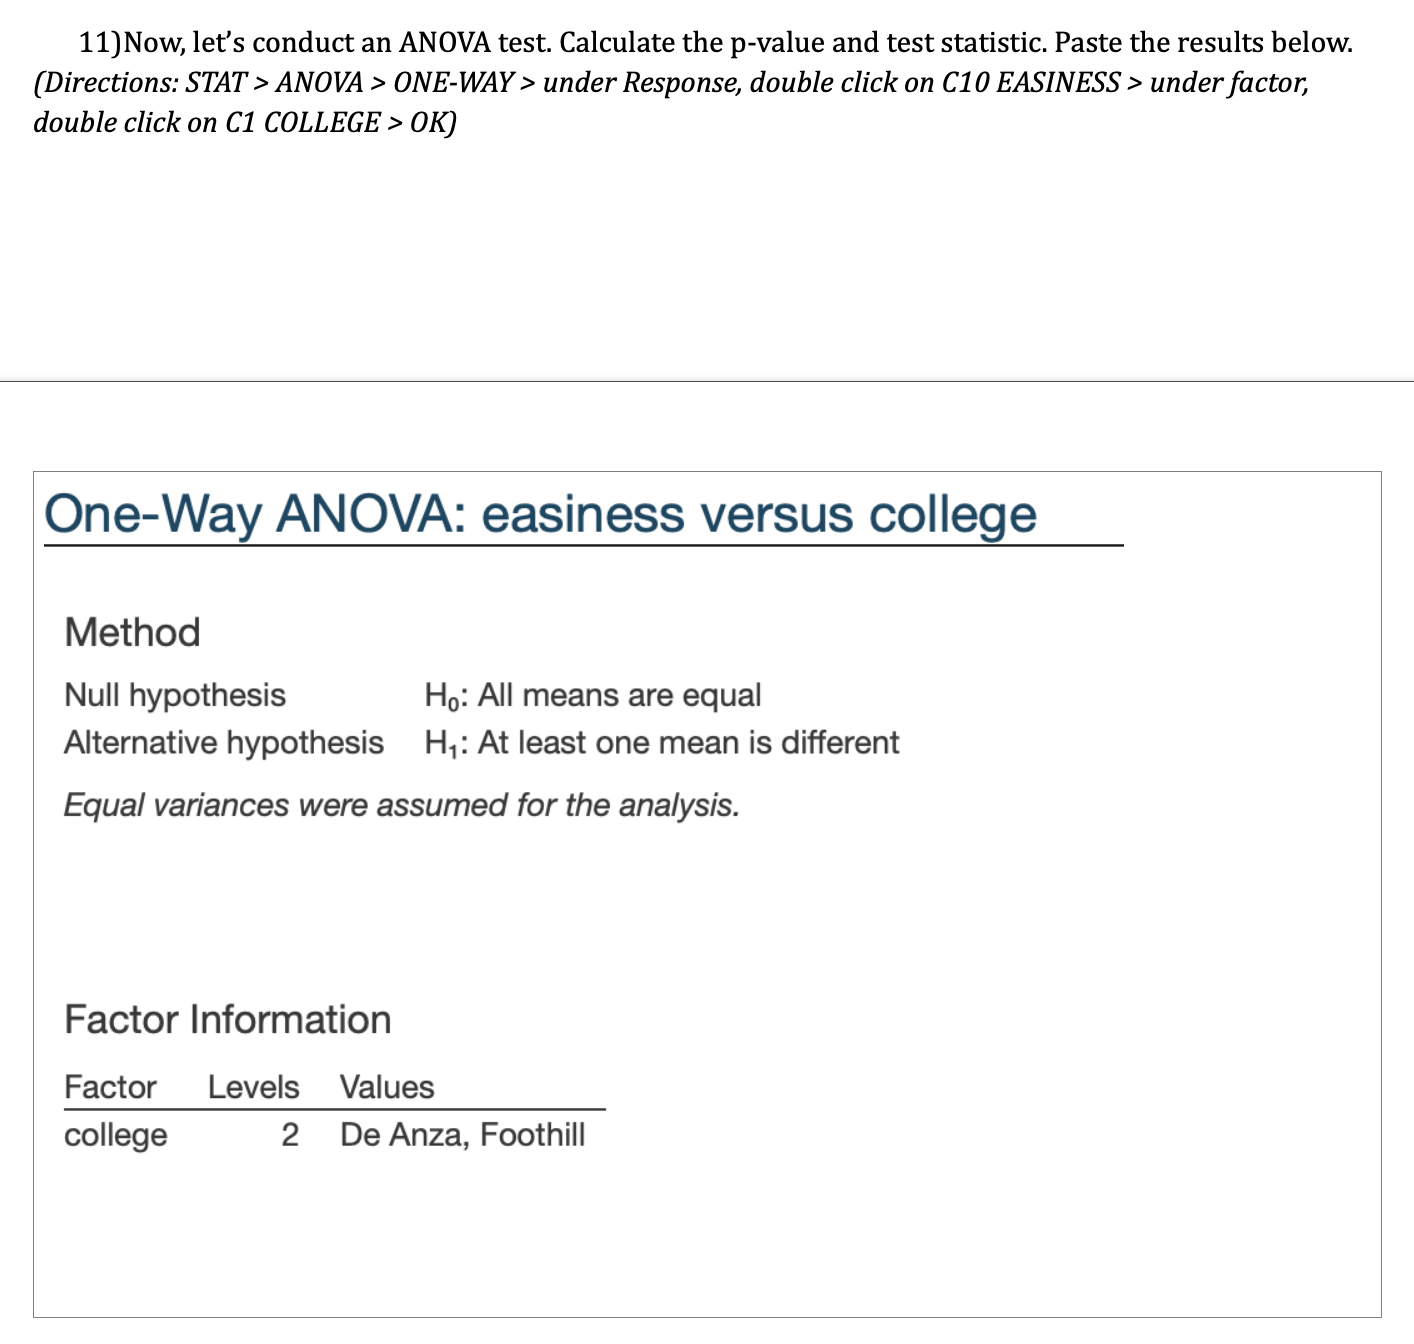
In this lab, you will use One Way Analysis of Variance Tests to determine whether 2 or more populations have the same average. Open the RateMmpj file. You will first design a hypothesis test to determine whether the average RateMyProfessor rating is equal among all FIVE of the different divisions at De Anza-Foothill Community College District. Note: We are comparing the divisions to each other, not the colleges to each other. 1) Suppose we are interested in determining whether the average RateMyProfessor rating is equal among the 5 different divisions at De Anza-Foothill Community College District. Construct the null 8: alternative hypotheses, in symbols. Also, explain the meaning of the symbols in the context of the problem 2) Describe the type 1 8: type 2 errors, in the context of the problem. 3) Let's construct a histogram to see if we can tell whether certain divisions have higher ratings and certain divisions have lower ratings. Construct 5 histograms, one for each division. Paste the results below. Which of the divisions looks like it has the lowest average overall rating? Which of the divisions looks like it has the highest average overall rating?I If you cannot tell, just write that it is not clear. (Directions: GRAPH > HISTOGRAM > SIMPLE > under Graph Variables, double click C9 OVERALL > MULTIPLE GRAPHS > under Show Graph Variables, click on IN SEPARATE PANELS OF THE SAME GRAPH > click on BY VARIABLES Tab > under By Variables with Groups in Separate Panels, double click on C7 DIVISION > OK > 0K) Histogram of overall 1.8 2.4 3.0 3.6 4.2 4.8 Certificate Programs/Other Creative Arts/Physical Ed Language/International/Multicultural 24 18 12 6 Frequency Physical and Health Science Social Studies/Humanities/Business 1.8 2.4 3.0 3.6 4.2 4.8 24 18 12 6 . 1.8 2.4 3.0 3.6 4.2 4.8 overall 4) Now, let's conduct an ANOVA test. Calculate the p-value and test statistic. Paste the results below. (Directions: STAT > ANOVA > ONE-WAY > under Response, double click on C9 OVERALL > under factor, double click on C7 DIVISION > OK) Method Null hypothesis Ho: All means are equal Alternative hypothesis H,: At least one mean is different Equal variances were assumed for the analysis. Factor Information Factor Levels Values Division 5 Certificate Programs/Other, Creative Arts/Physical Ed, Language/International/Multicultural, Physical and Health Science, Social Studies/Humanities/Business5) Using a signicance level of 5%, do you reject or fail to reject the null hypothesis? Why? Explain your conclusion in the context of the problem. 6) When we make our conclusion to reject or fail to reject the null hypothesis, we make an educated decision based on the available data. However, it is possible to make the incorrect decision. If your decision in problem #5 is the incorrect decision, is it a type 1 error or a type 2 error? 7) Now, let's investigate whether the average easiness levels are the same or different among different genders at De Anza and Foothill Colleges. Construct the null 8: alternative hypotheses, in symbols. Also, explain the meaning of the symbols in the context of the problem. 8) Now, let's conduct an ANOVA test. Calculate the p-value and test statistic. Paste the results below. (Directions: STAT > ANOVA > 0NEWAY> under Response, double click on 6'10 EASINESS > under factor, double click on CS GENDER > 010 One-Way ANOVA: easiness versus gender Method Null hypothesis Ho: All means are equal Alternative hypothesis H: At least one mean is different Equal variances were assumed for the analysis. Factor Information Factor Levels Values gender 2 Female, Male 9) Using a signicance level of 5%, do you reject or fail to reject the null hypothesis? Why? Explain your conclusion in the context of the problem. 10) Now, let' 5 investigate whether the average easiness level is the same or different between De Anza and Foothill Colleges. Construct the null 82 alternative hypotheses, in symbols. Also, explain the meaning of the symbols in the context of the problem. 11) Now, let's conduct an ANOVA test. Calculate the p-value and test statistic. Paste the results below. (Directions: STAT > AN OVA > 0NE-WAY> under Response, double click on 610 EASINESS > under factor, double click on CI COLLEGE > 0K) One-Way ANOVA: easiness versus college Method Null hypothesis Ho: All means are equal Alternative hypothesis H.: At least one mean is different Equal variances were assumed for the analysis. Factor Information Factor Levels Values college 2 De Anza, Foothill 12) Using a significance level of 5%, do you reject or fail to reject the null hypothesis? Why? Explain your conclusion in the context of the