Hello. Please help with data table . We are getting different results . Thank you 1. Support the motion detector about 2 m above the
Hello. Please help with data table . We are getting different results . Thank you
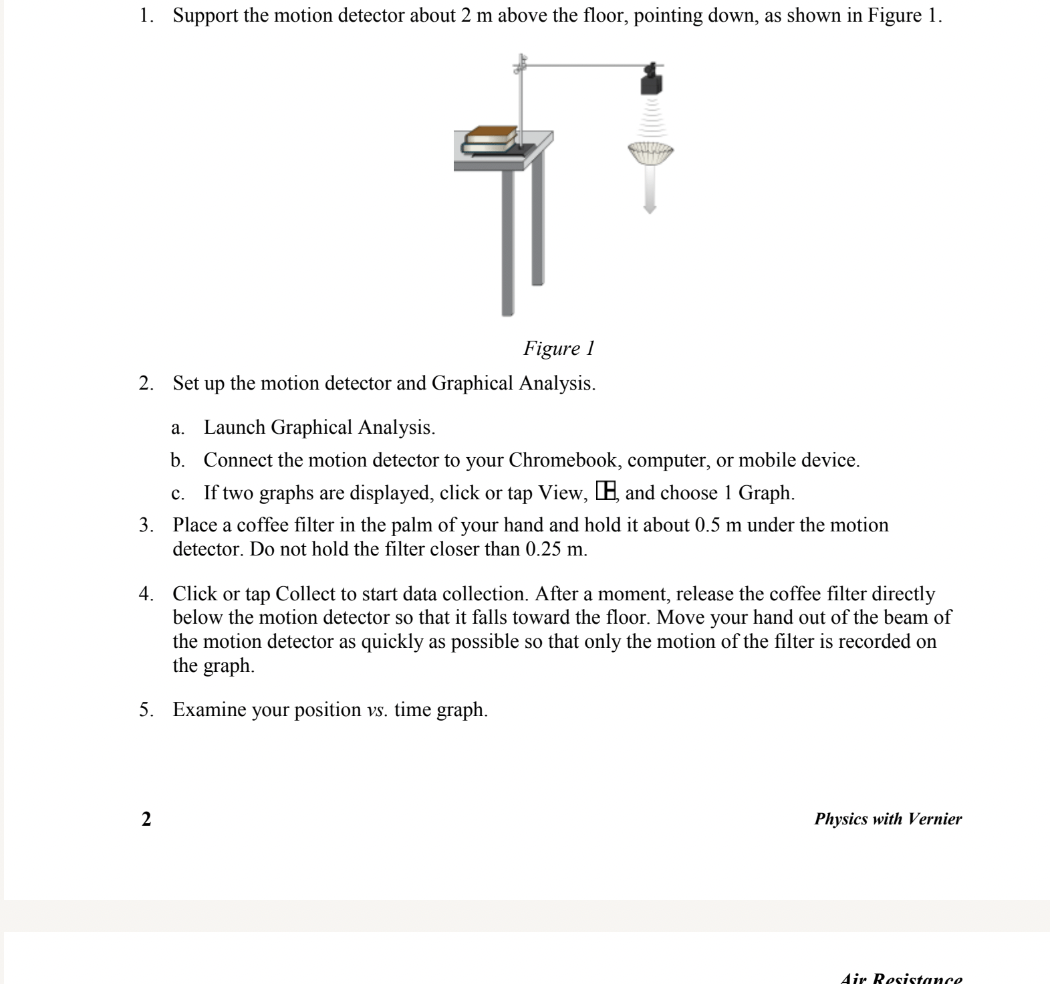
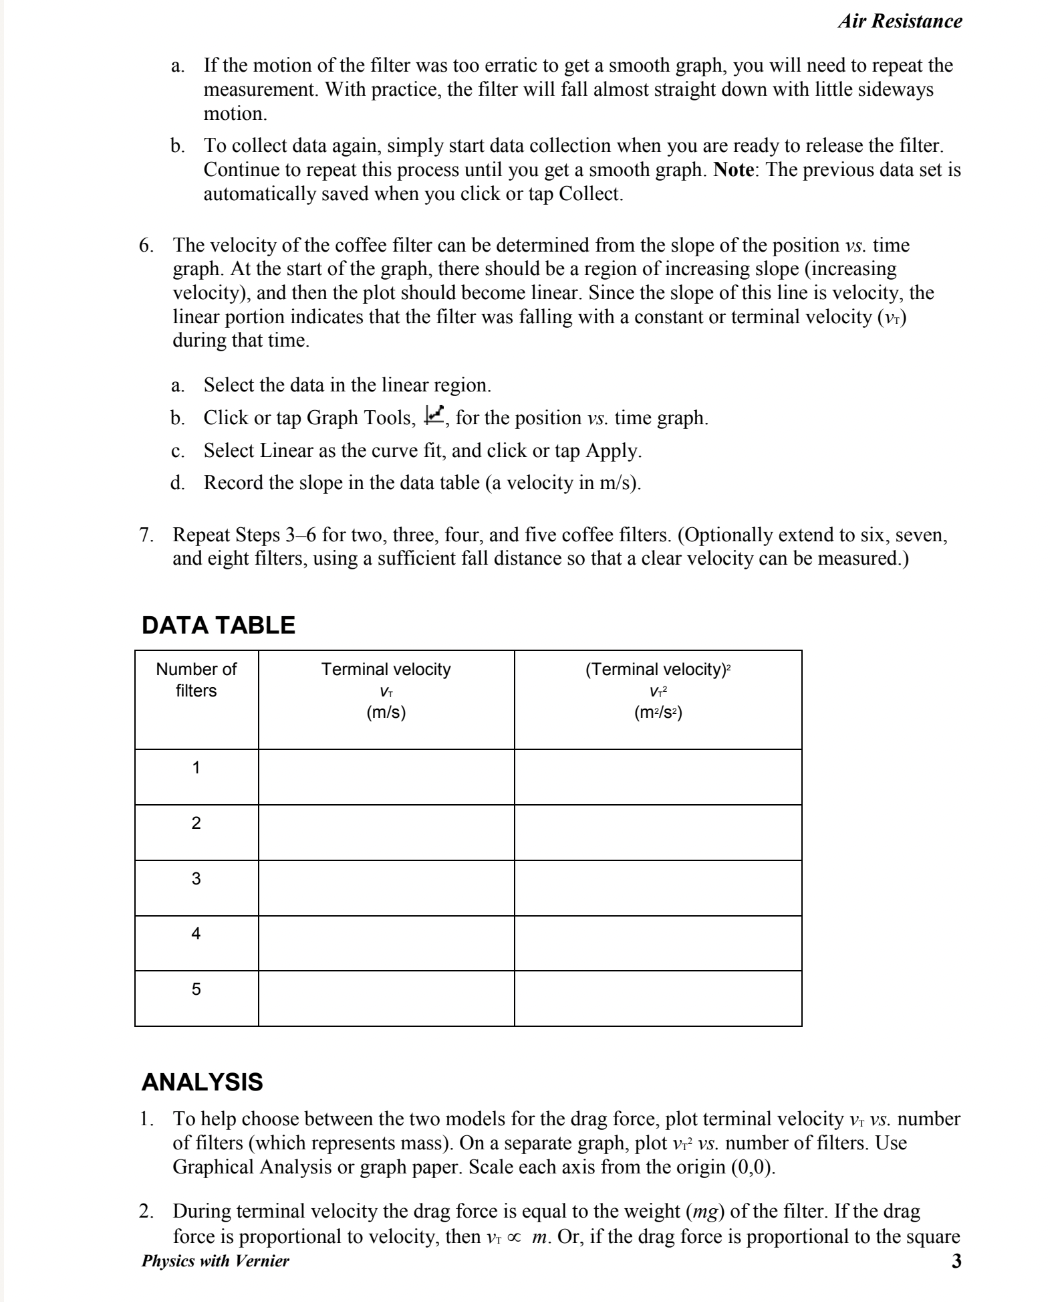
1. Support the motion detector about 2 m above the floor, pointing down, as shown in Figure 1. Figure 1 2. Set up the motion detector and Graphical Analysis. a. Launch Graphical Analysis. b. Connect the motion detector to your Chromebook, computer, or mobile device. c. If two graphs are displayed, click or tap View, H, and choose 1 Graph. 3. Place a coffee filter in the palm of your hand and hold it about 0.5 m under the motion detector. Do not hold the filter closer than 0.25 m. 4. Click or tap Collect to start data collection. After a moment, release the coffee filter directly below the motion detector so that it falls toward the floor. Move your hand out of the beam of the motion detector as quickly as possible so that only the motion of the filter is recorded on the graph. 5. Examine your position vs. time graph. N Physics with VernierAir Resistance a. If the motion of the filter was too erratic to get a smooth graph, you will need to repeat the measurement. With practice, the filter will fall almost straight down with little sideways motion. To collect data again, simply start data collection when you are ready to release the filter. Continue to repeat this process until you get a smooth graph. Note: The previous data set is automatically saved when you click or tap Collect. 6. The velocity of the coffee filter can be determined from the slope of the position vs. time graph. At the start of the graph, there should be a region of increasing slope (increasing velocity), and then the plot should become linear. Since the slope of this line is velocity, the linear portion indicates that the filter was falling with a constant or terminal velocity (VT) during that time. a. Select the data in the linear region. b. Click or tap Graph Tools, , for the position vs. time graph. c. Select Linear as the curve fit, and click or tap Apply. d. Record the slope in the data table (a velocity in m/s). 7. Repeat Steps 3-6 for two, three, four, and five coffee filters. (Optionally extend to six, seven, and eight filters, using a sufficient fall distance so that a clear velocity can be measured.) DATA TABLE Number of Terminal velocity Terminal velocity) filters VT V12 (m/s) (mz/sz) 1 2 3 4 5 ANALYSIS 1. To help choose between the two models for the drag force, plot terminal velocity , vs. number of filters (which represents mass). On a separate graph, plot vr vs. number of filters. Use Graphical Analysis or graph paper. Scale each axis from the origin (0,0). . During terminal velocity the drag force is equal to the weight (mg) of the filter. If the drag force is proportional to velocity, then vr o m. Or, if the drag force is proportional to the square Physics with Vernier
Step by Step Solution
There are 3 Steps involved in it
Step: 1
Get Instant Access to Expert-Tailored Solutions
See step-by-step solutions with expert insights and AI powered tools for academic success
Step: 2
Step: 3
Ace Your Homework with AI
Get the answers you need in no time with our AI-driven, step-by-step assistance