Hello,
When I run my code in the cloud9 ide it just exits out without showing the data I need. Also, how do I input the points in excel to make a graph? We haven't learned about using the graphs in python to plot graphs. Due tomorrow. Thank you!
Code:
#import math library import math
#take the val of pi and assign to local var pi pi = math.pi
#list of vals for parts a and b pi_ranges = [x / 64 for x in range(-128, 129, 1)]
#multiply all numbers by pi to get range of vals for l in range(pi_ranges.__len__()): pi_ranges[l] = pi_ranges[l] * pi #make range of vals for part c and d num_ranges = [x /10 for x in range(0, 2001, 5)]
#A) #makes list same size as pi_ranges sin_values = list(range(pi_ranges.__len__()))
#calculate and store vals sin for v in range(sin_values.__len__()): sin_values[v] = math.sin(pi_ranges[v])
#B) #makes list same size as pi_ranges cos_values = list(range(pi_ranges.__len__()))
#calculate and store vals cos for v in range(cos_values.__len__()): cos_values[v] = math.cos(pi_ranges[v]) #C) #makes list same size as pi_ranges sqrt_values = list(range(pi_ranges.__len__()))
#calculate and store vals cos for v in range(sqrt_values.__len__()): sqrt_values[v] = math.sqrt(pi_ranges[v]) #D) #makes list same size as pi_ranges log10_values = list(range(pi_ranges.__len__()-1))
#calculate and store vals cos for v in range(log10_values.__len__()): log10_values[v] = math.log10(pi_ranges[v + 1])
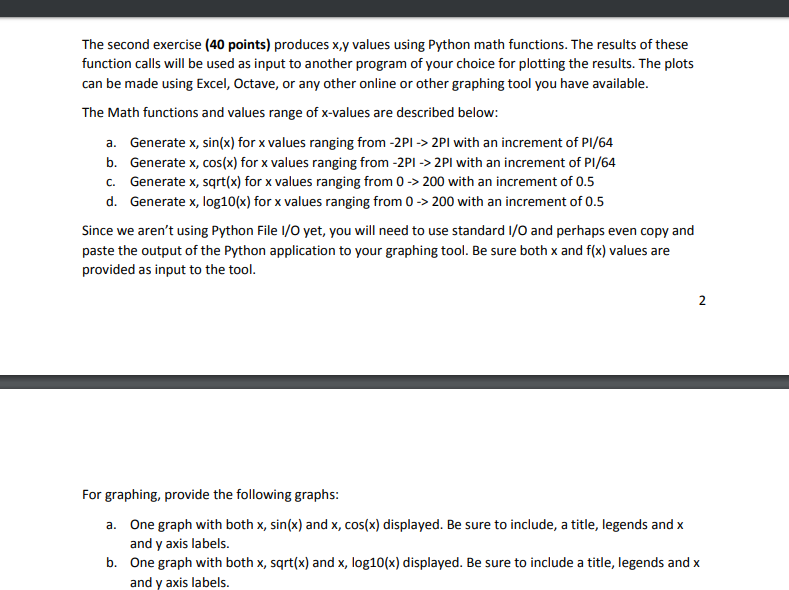
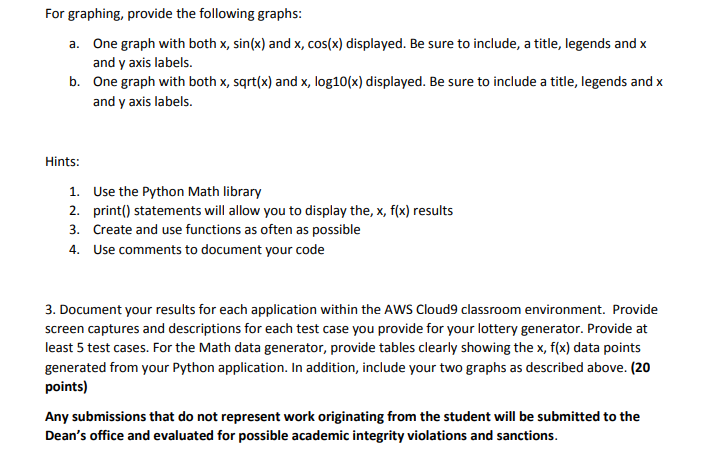
The second exercise (40 points) produces x,y values using Python math functions. The results of these function calls will be used as input to another program of your choice for plotting the results. The plots can be made using Excel, Octave, or any other online or other graphing tool you have available. The Math functions and values range of x-values are described below: a. Generate x, sin(x) for x values ranging from -2PI -> 2PI with an increment of P1/64 b. Generate x, cos(x) for x values ranging from -2PI -> 2PI with an increment of P1/64 C. Generate x, sqrt(x) for x values ranging from 0 -> 200 with an increment of 0.5 d. Generate x, log10(x) for x values ranging from 0 -> 200 with an increment of 0.5 Since we aren't using Python File 1/0 yet, you will need to use standard I/O and perhaps even copy and paste the output of the Python application to your graphing tool. Be sure both x and f(x) values are provided as input to the tool. For graphing, provide the following graphs: a. One graph with both x, sin(x) and x, cos(x) displayed. Be sure to include, a title, legends and x and y axis labels. b. One graph with both x, sqrt(x) and x, log10(x) displayed. Be sure to include a title, legends and x and y axis labels. For graphing, provide the following graphs: a. One graph with both x, sin(x) and x, cos(x) displayed. Be sure to include, a title, legends and x and y axis labels. b. One graph with both x, sqrt(x) and x, log10(x) displayed. Be sure to include a title, legends and x and y axis labels. Hints: 1. Use the Python Math library 2.print() statements will allow you to display the, x, f(x) results 3. Create and use functions as often as possible 4. Use comments to document your code 3. Document your results for each application within the AWS Cloud9 classroom environment. Provide screen captures and descriptions for each test case you provide for your lottery generator. Provide at least 5 test cases. For the Math data generator, provide tables clearly showing the x, f(x) data points generated from your Python application. In addition, include your two graphs as described above. (20 points) Any submissions that do not represent work originating from the student will be submitted to the Dean's office and evaluated for possible academic integrity violations and sanctions. The second exercise (40 points) produces x,y values using Python math functions. The results of these function calls will be used as input to another program of your choice for plotting the results. The plots can be made using Excel, Octave, or any other online or other graphing tool you have available. The Math functions and values range of x-values are described below: a. Generate x, sin(x) for x values ranging from -2PI -> 2PI with an increment of P1/64 b. Generate x, cos(x) for x values ranging from -2PI -> 2PI with an increment of P1/64 C. Generate x, sqrt(x) for x values ranging from 0 -> 200 with an increment of 0.5 d. Generate x, log10(x) for x values ranging from 0 -> 200 with an increment of 0.5 Since we aren't using Python File 1/0 yet, you will need to use standard I/O and perhaps even copy and paste the output of the Python application to your graphing tool. Be sure both x and f(x) values are provided as input to the tool. For graphing, provide the following graphs: a. One graph with both x, sin(x) and x, cos(x) displayed. Be sure to include, a title, legends and x and y axis labels. b. One graph with both x, sqrt(x) and x, log10(x) displayed. Be sure to include a title, legends and x and y axis labels. For graphing, provide the following graphs: a. One graph with both x, sin(x) and x, cos(x) displayed. Be sure to include, a title, legends and x and y axis labels. b. One graph with both x, sqrt(x) and x, log10(x) displayed. Be sure to include a title, legends and x and y axis labels. Hints: 1. Use the Python Math library 2.print() statements will allow you to display the, x, f(x) results 3. Create and use functions as often as possible 4. Use comments to document your code 3. Document your results for each application within the AWS Cloud9 classroom environment. Provide screen captures and descriptions for each test case you provide for your lottery generator. Provide at least 5 test cases. For the Math data generator, provide tables clearly showing the x, f(x) data points generated from your Python application. In addition, include your two graphs as described above. (20 points) Any submissions that do not represent work originating from the student will be submitted to the Dean's office and evaluated for possible academic integrity violations and sanctions