

Answered step by step
Verified Expert Solution
Question
1 Approved Answer
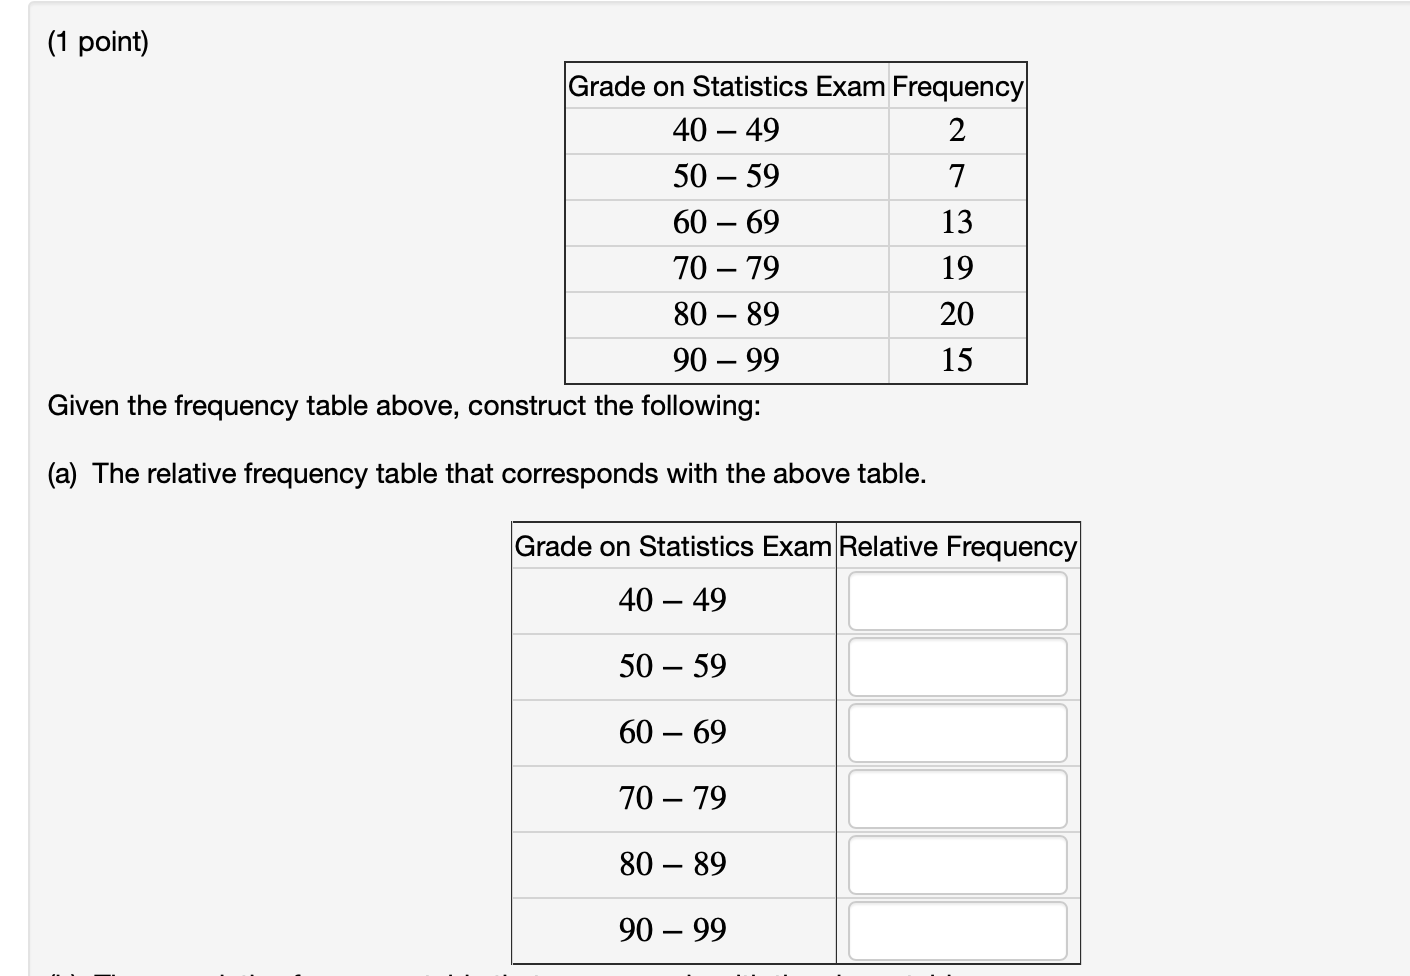
help (1 point) Grade on Statistics Exam Frequency 4049 5059 6069 70 79 80 89 90 99 Given the frequency table above, construct the following:
help

Step by Step Solution
There are 3 Steps involved in it
Step: 1

Get Instant Access to Expert-Tailored Solutions
See step-by-step solutions with expert insights and AI powered tools for academic success
Step: 2

Step: 3
Ace Your Homework with AI
Get the answers you need in no time with our AI-driven, step-by-step assistance
Get Started
Paradoxes In Mathematics
Authors: Stanley J Farlow
1st Edition
0486791734, 9780486791739