

Answered step by step
Verified Expert Solution
Question
1 Approved Answer
Help A through G please urban, rural, and suburban. The groups vary in size. Complete parts (a) through (g) below. Assume a 0.05 level of
Help A through G please
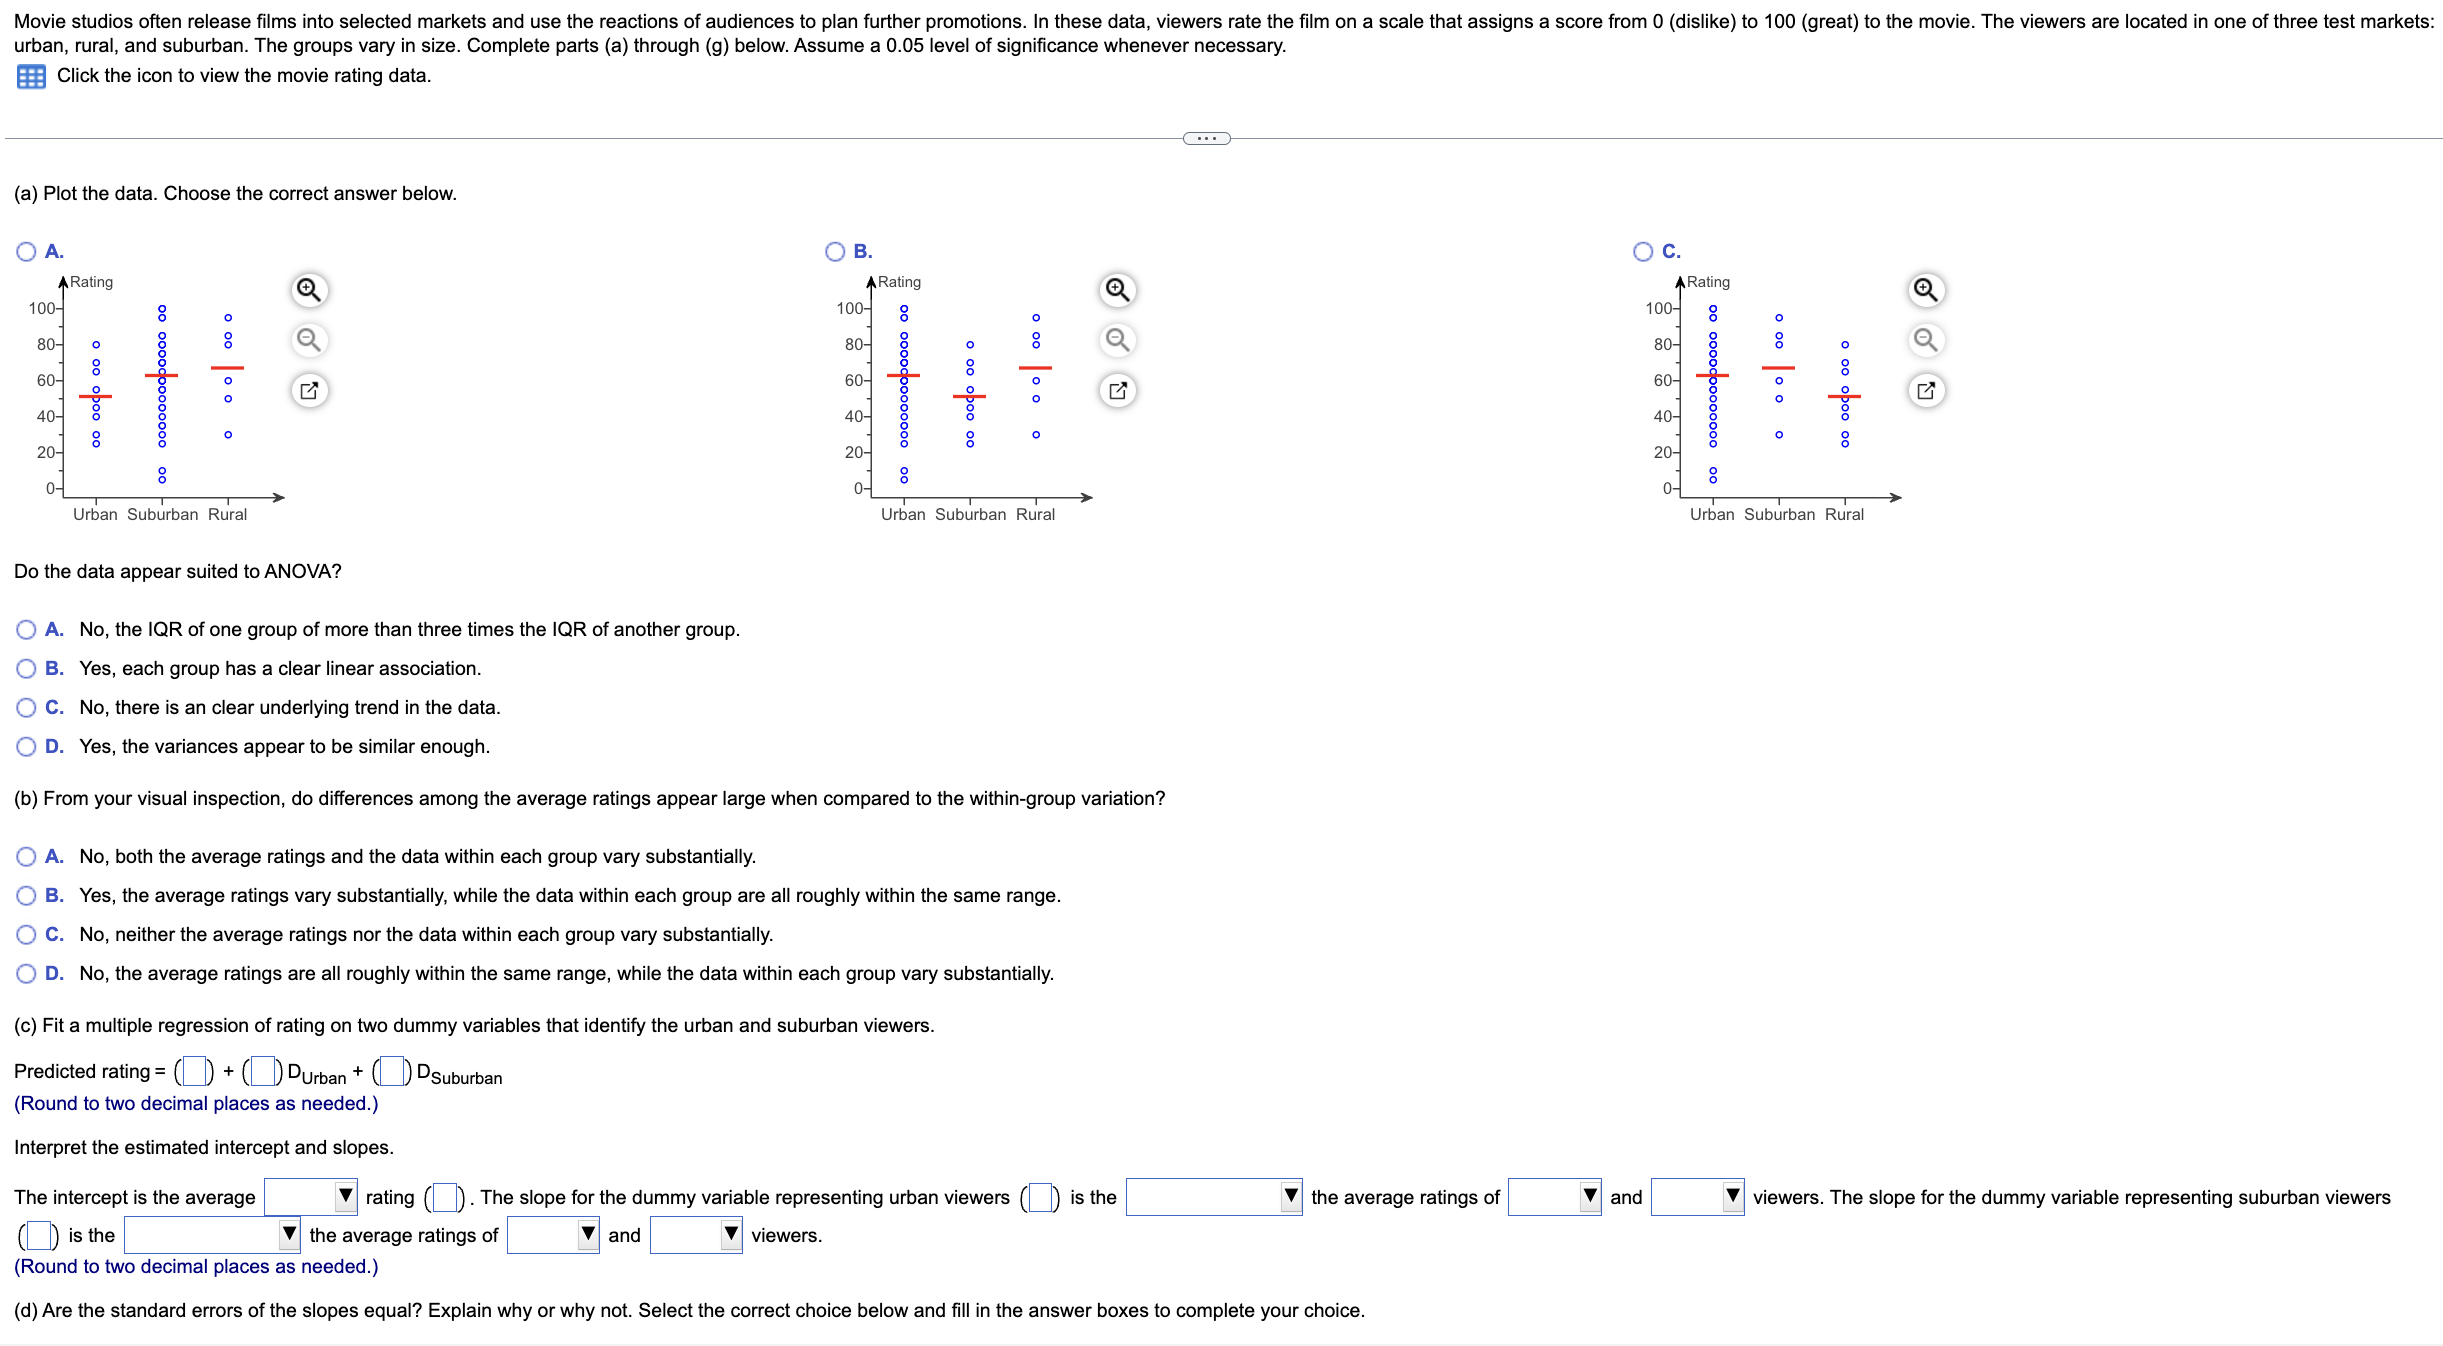
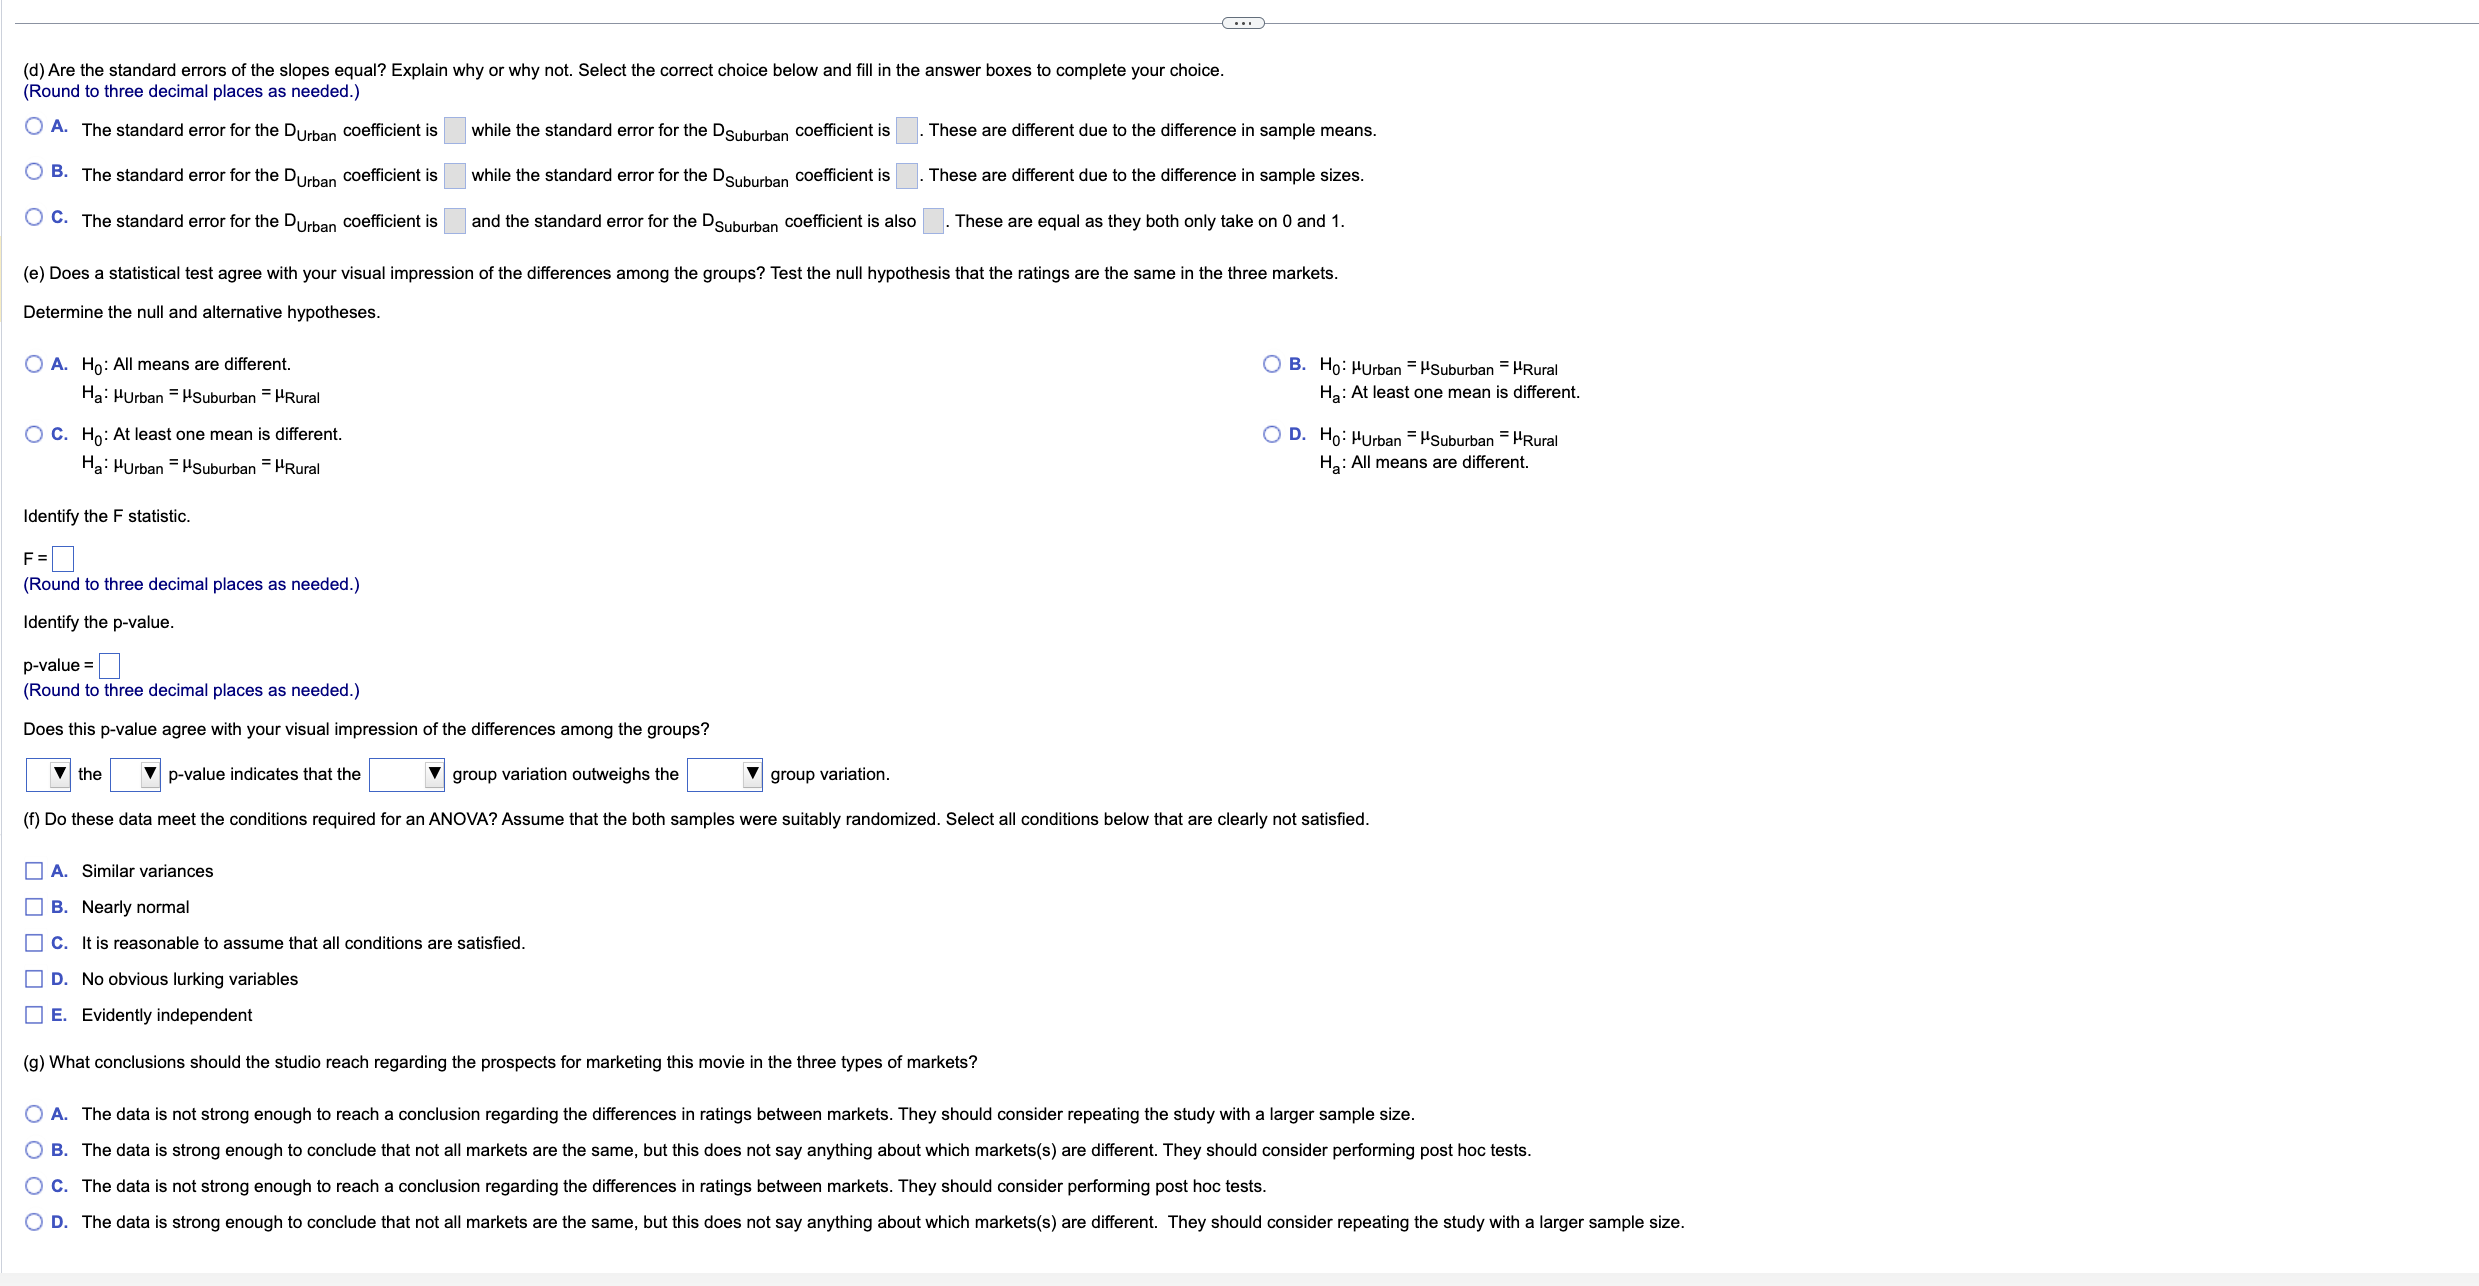
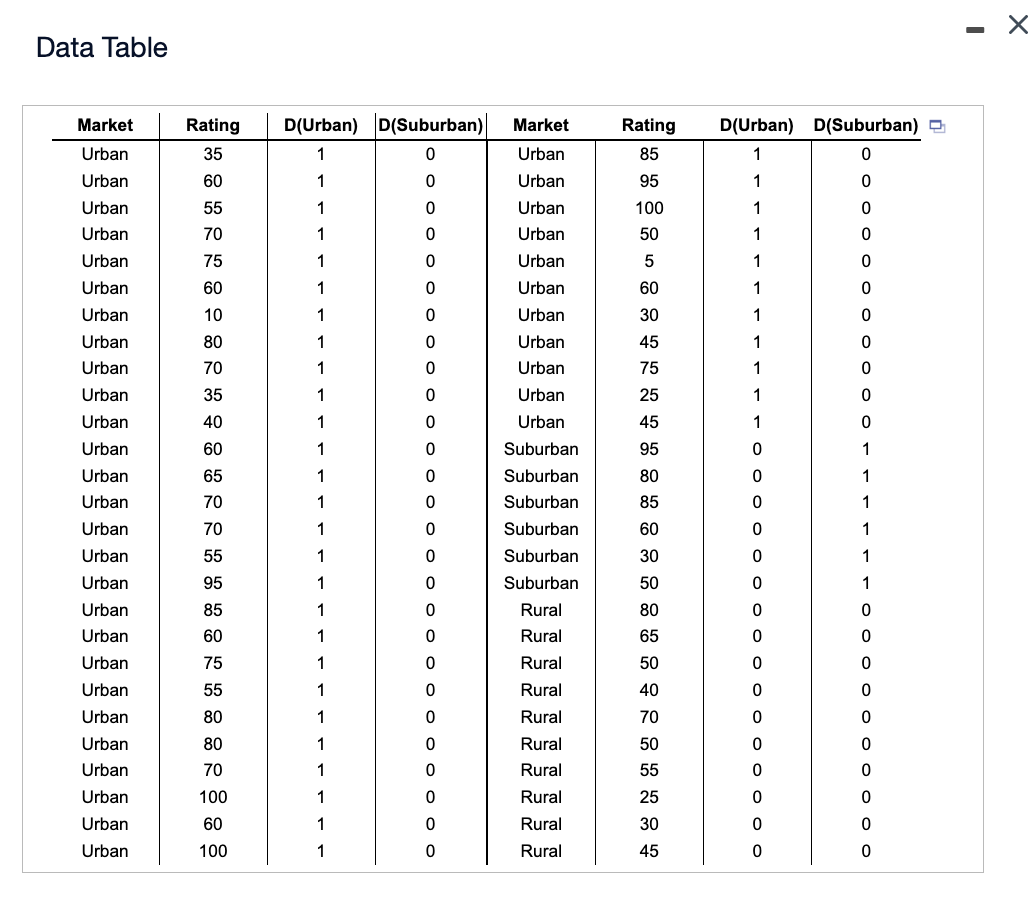
urban, rural, and suburban. The groups vary in size. Complete parts (a) through (g) below. Assume a 0.05 level of significance whenever necessary. Click the icon to view the movie rating data. (a) Plot the data. Choose the correct answer below. Do the data appear suited to ANOVA? A. No, the IQR of one group of more than three times the IQR of another group. B. Yes, each group has a clear linear association. C. No, there is an clear underlying trend in the data. D. Yes, the variances appear to be similar enough. (b) From your visual inspection, do differences among the average ratings appear large when compared to the within-group variation? A. No, both the average ratings and the data within each group vary substantially. B. Yes, the average ratings vary substantially, while the data within each group are all roughly within the same range. C. No, neither the average ratings nor the data within each group vary substantially. D. No, the average ratings are all roughly within the same range, while the data within each group vary substantially. (c) Fit a multiple regression of rating on two dummy variables that identify the urban and suburban viewers. Predicted rating =1+DUrban+ ) DSuburban (Round to two decimal places as needed.) Interpret the estimated intercept and slopes. The intercept is the average rating | | The slope for the dummy variable representing urban viewers is the the average ratings of viewers. The slope for the dummy variable representing suburban viewers is the the average ratings of and viewers. (Round to two decimal places as needed.) (d) Are the standard errors of the slopes equal? Explain why or why not. Select the correct choice below and fill in the answer boxes to complete your choice. (d) Are the standard errors of the slopes equal? Explain why or why not. Select the correct choice below and fill in the answer boxes to complete your choice. (Round to three decimal places as needed.) A. The standard error for the DUrban coefficient is 3. The standard error for the DUrban coefficient is C. The standard error for the DUrban coefficient is while the standard error for the DSuburban coefficient is while the standard error for the DSuburban coefficient is and the standard error for the DSuburban coefficient is also These are different due to the difference in sample means. These are different due to the difference in sample sizes. These are equal as they both only take on 0 and 1. (e) Does a statistical test agree with your visual impression of the differences among the groups? Test the null hypothesis that the ratings are the same in the three markets. Determine the null and alternative hypotheses. A. H0 : All means are different. Ha:Urban=Suburban=Rural H0 : At least one mean is different. Ha:Urban=Suburban=Rural Identify the F statistic. F= (Round to three decimal places as needed.) Identify the p-value. p-value = (Round to three decimal places as needed.) Does this p-value agree with your visual impression of the differences among the groups? the p-value indicates that the group variation outweighs the B. H0:Urban=Suburban=Rural Ha : At least one mean is different. D. H0:Urban=Suburban=Rural Ha : All means are different. (f) Do these data meet the conditions required for an ANOVA? Assume that the both samples were suitably randomized. Select all conditions below that are clearly not satisfied. A. Similar variances B. Nearly normal C. It is reasonable to assume that all conditions are satisfied. D. No obvious lurking variables E. Evidently independent (g) What conclusions should the studio reach regarding the prospects for marketing this movie in the three types of markets? A. The data is not strong enough to reach a conclusion regarding the differences in ratings between markets. They should consider repeating the study with a larger sample size. C. The data is not strong enough to reach a conclusion regarding the differences in ratings between markets. They should consider performing post hoc tests. Data TableStep by Step Solution
There are 3 Steps involved in it
Step: 1

Get Instant Access to Expert-Tailored Solutions
See step-by-step solutions with expert insights and AI powered tools for academic success
Step: 2

Step: 3
Ace Your Homework with AI
Get the answers you need in no time with our AI-driven, step-by-step assistance
Get Started
Take Action For Performance Under Pressure How To Handle Stress And Succeed
Authors: Arnulfo Wedige
1st Edition
979-8388686084