HELP ALL PARTS ASAP PLEASE

SORRY HERE YOU GO!

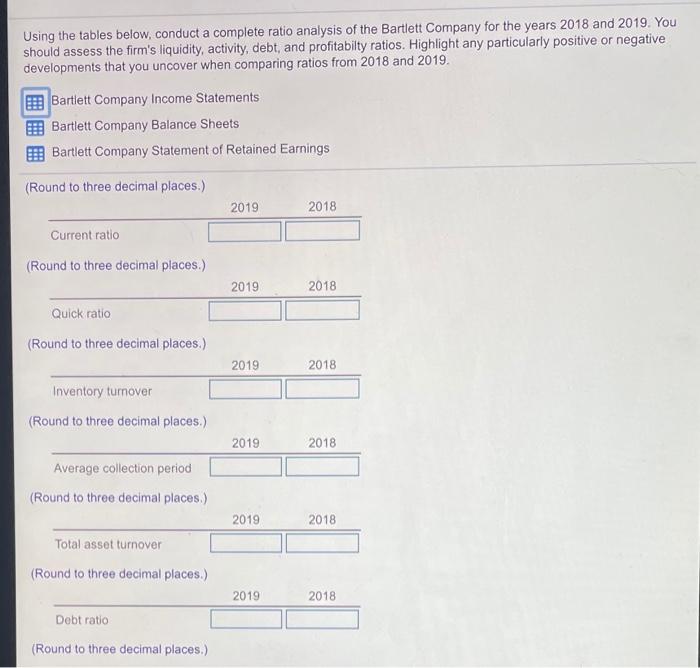
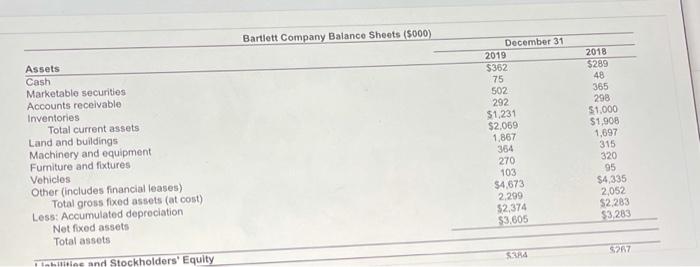
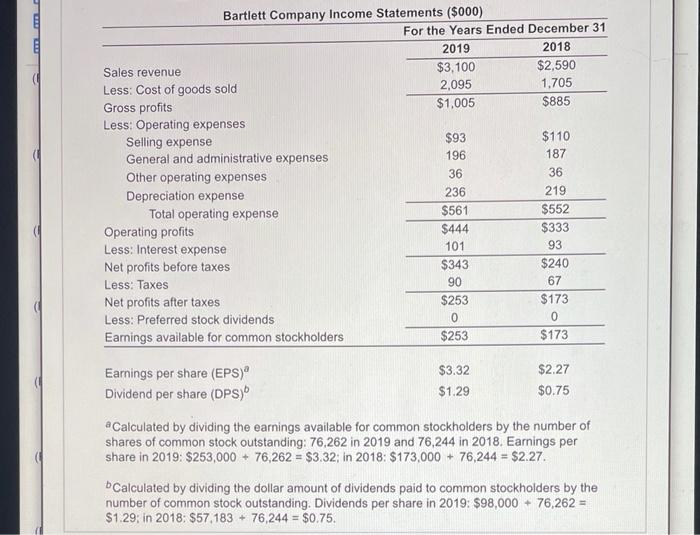
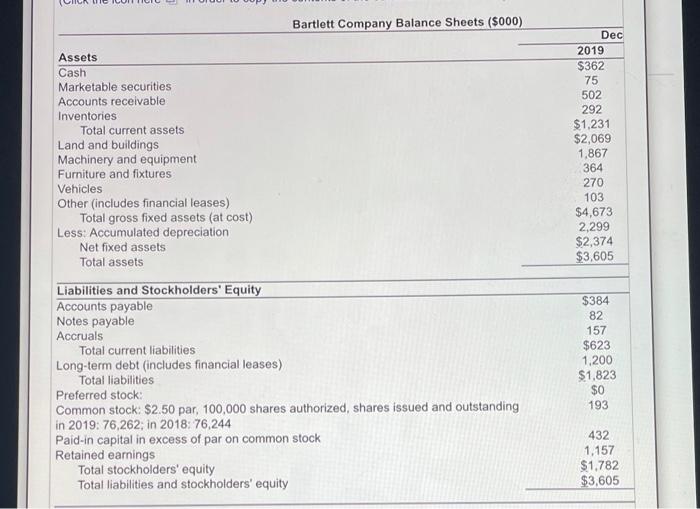
Using the tables below, conduct a complete ratio analysis of the Bartlett Company for the years 2018 and 2019. You should assess the firm's liquidity, activity, debt, and profitabilty ratios. Highlight any particularly positive or negative developments that you uncover when comparing ratios from 2018 and 2019. Bartlett Company Income Statements Bartlett Company Balance Sheets Bartlett Company Statement of Retained Earnings (Round to three decimal places.) 2019 2018 Current ratio (Round to three decimal places.) 2019 2018 Quick ratio (Round to three decimal places.) 2019 2018 Inventory turnover (Round to three decimal places.) 2019 2018 Average collection period (Round to three decimal places.) 2019 2018 Total asset turnover (Round to three decimal places.) 2019 2018 Debt ratio (Round to three decimal places.) Bartlett Company Income Statements ($000) For the Years Ended December 31 2019 2018 Sales revenue $3,100 $2,590 Less: Cost of goods sold 2,095 1,705 Gross profits $1,005 $885 Less: Operating expenses Selling expense $93 $110 General and administrative expenses 196 187 Other operating expenses 36 36 Depreciation expense 236 219 Total operating expense $561 $552 Operating profits $444 $333 Less: Interest expense 101 93 Net profits before taxes $343 $240 Less: Taxes 90 67 Net profits after taxes $253 $173 Less: Preferred stock dividends 0 0 Earnings available for common stockholders $253 $173 Earnings per share (EPS) $3.32 $2.27 Dividend per share (DPS) $1.29 $0.75 a Calculated by dividing the earnings available for common stockholders by the number of shares of common stock outstanding: 76,262 in 2019 and 76,244 in 2018. Earnings per share in 2019: $253,000 + 76,262 = $3.32; in 2018: $173,000 + 76,244 = $2.27. bCalculated by dividing the dollar amount of dividends paid to common stockholders by the number of common stock outstanding. Dividends per share in 2019: $98,000 + 76,262 = $1.29; in 2018: $57,183 + 76,244 = $0.75. Bartlett Company Balance Sheets ($000) Dec 2019 $362 75 502 292 $1,231 $2,069 1,867 364 270 103 $4,673 2,299 $2,374 $3,605 Assets Cash Marketable securities Accounts receivable Inventories Total current assets Land and buildings Machinery and equipment Furniture and fixtures Vehicles Other (includes financial leases) Total gross fixed assets (at cost) Less: Accumulated depreciation Net fixed assets Total assets Liabilities and Stockholders' Equity Accounts payable Notes payable Accruals Total current liabilities Long-term debt (includes financial leases) Total liabilities Preferred stock Common stock: $2.50 par, 100,000 shares authorized, shares issued and outstanding in 2019: 76,262; in 2018: 76,244 Paid-in capital in excess of par on common stock Retained earnings Total stockholders' equity Total liabilities and stockholders' equity $384 82 157 $623 1,200 $1,823 $0 193 432 1,157 $1,782 $3,605 Bartlett Company Statement of Retained Earnings ($000) for the Year Ended December 31, Retained earnings balance (January 1, 2019) $1,012 Plus: Net profits after taxes (for 2019) 253 Less: Cash dividends (paid during 2019) Preferred stock 0 Common stock 98 Total dividends paid $108 Retained earnings balance (December 31, 2019) $1,157 Bartlett Company Balance Sheets (5000) Assets Cash Marketable securities Accounts receivable Inventories Total current assets Land and buildings Machinery and equipment Furniture and fixtures Vehicles Other (includes financial leases) Total gross fixed assets (at cost) Less: Accumulated depreciation Not fixed assets Total assets December 31 2019 $362 75 502 292 $1.231 $2,059 1.867 354 270 103 $4.673 2.299 52.374 $3.605 2018 $289 48 365 298 $1.000 51.908 1,697 315 320 95 $4.335 2,052 52 283 $3,283 5217 SURA tine and Stockholders' Equity 52374 $3.605 52 283 $3,283 $267 100 Not fixed assets Total assets Liabilities and Stockholders' Equity Accounts payable Notes payable Accruals Total current liabilities Long-term debt (includes financial leases) Total liabilities Preferred stock Common stock $250 par 100,000 shares authorized, sharon inued and outstanding in 2019: 76,262; in 2018: 76.244 Paid-in capital in excess of par on common stock Retained oamings Total stockholders' equity Total liabilities and stockholders' equity 5384 82 157 5623 1.200 $1,823 $0 193 5483 1.177 51.660 SO 193 432 1.157 51.782 53.605 418 1,012 51.623 53.283


