

Answered step by step
Verified Expert Solution
Question
1 Approved Answer
Help Consider the figure below, which plots the evolution of TCPs congestion window at the beginning of each time unit(where the unit of time is
Help 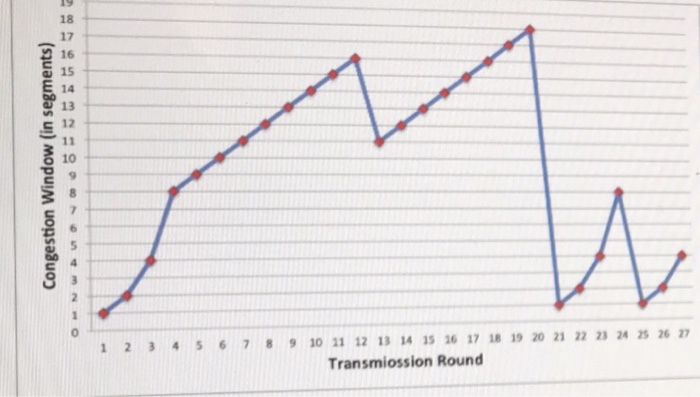
18 2 16 15 E 14 C 12 10 1 23 4 5678 9 10 1 1 13 14 15 16 17 18 19 20 21 22 23 24 25 26 27 Transmiossion Round Consider the figure below, which plots the evolution of TCPs congestion window at the beginning of each time unit(where the unit of time is equal the RTT).
The initial value of cwnd is 1 and the initial value of ssthresh is 8.
1) Give the range of times (as StartTime-EndTime) at which TCP is slow start:
2) Give the range of times (as StartTime-EndTime) at which TCP is in congestion avoidance:
3) Give the time at which TCP is in fast recovery at the start of a time slot, when the flight of packets is sent:
4) Give the times as which the first packet in the sent flight of packets is lost that was detected via timeout:
5) Give the times at which the first packet in the sent flight of packets is lost that was detected via triple duplicate ACKs:
6) Give the times at which the value of ssthresh changes, and give the new value of ssthresh:
- Changed at ........... and the new ssthresh =
- Changed at ........... and the new ssthresh =
- Changed at ........... and the new ssthresh =
Step by Step Solution
There are 3 Steps involved in it
Step: 1

Get Instant Access to Expert-Tailored Solutions
See step-by-step solutions with expert insights and AI powered tools for academic success
Step: 2

Step: 3
Ace Your Homework with AI
Get the answers you need in no time with our AI-driven, step-by-step assistance
Get Started
Performing With Computer Applications Personal Information Manager Word Processing Desktop Publishing Spreadsheets Databases Presentations Assessment Manager
Authors: Iris Blanc
3rd Edition
141886515X, 978-1418865153