HELP

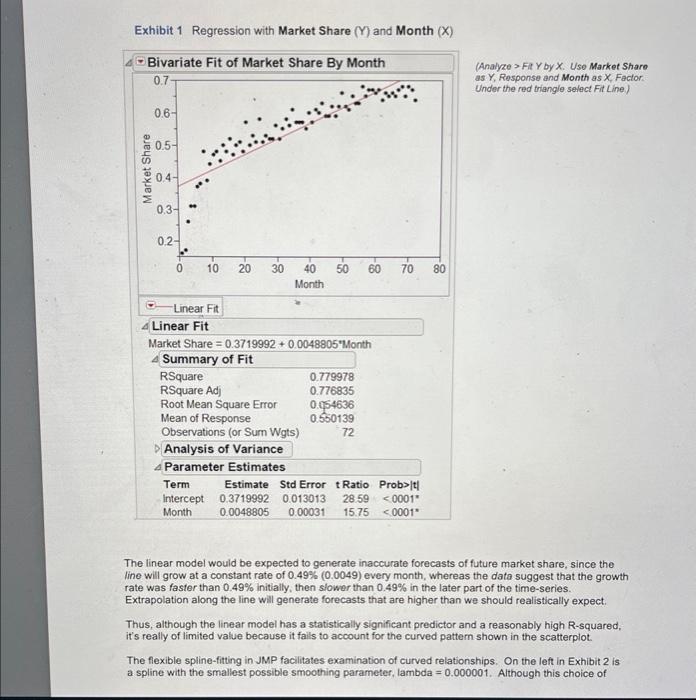
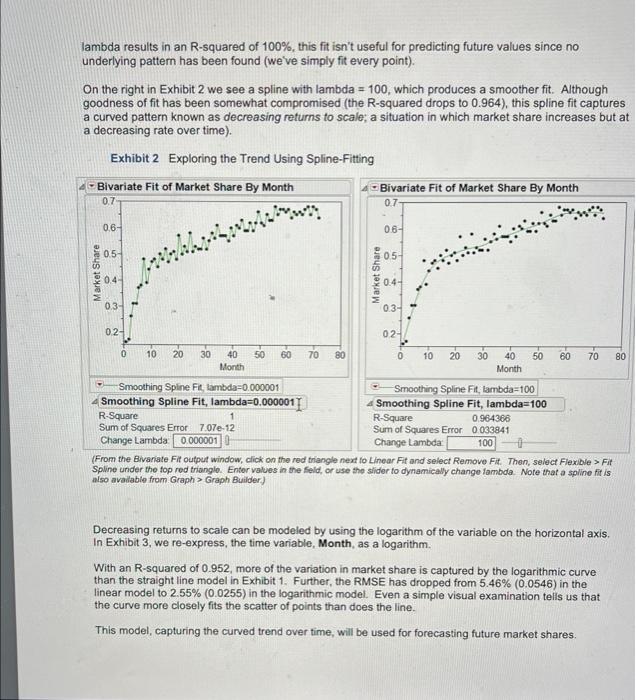
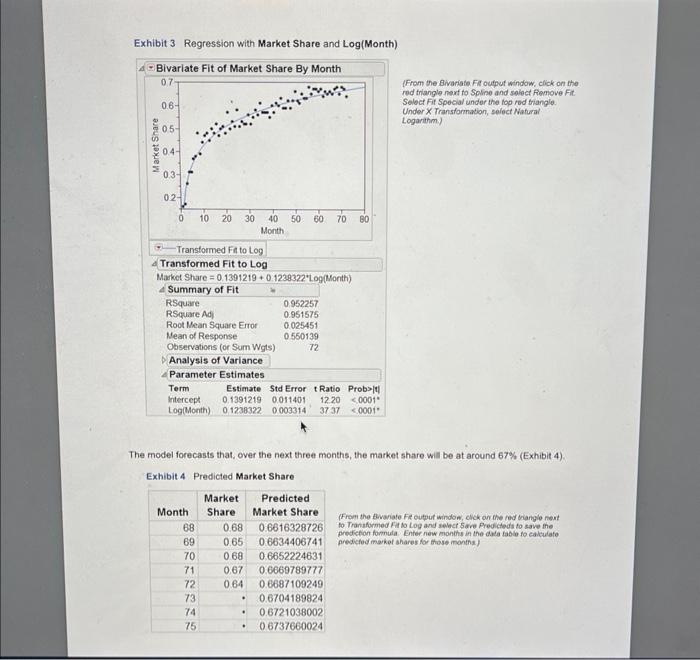
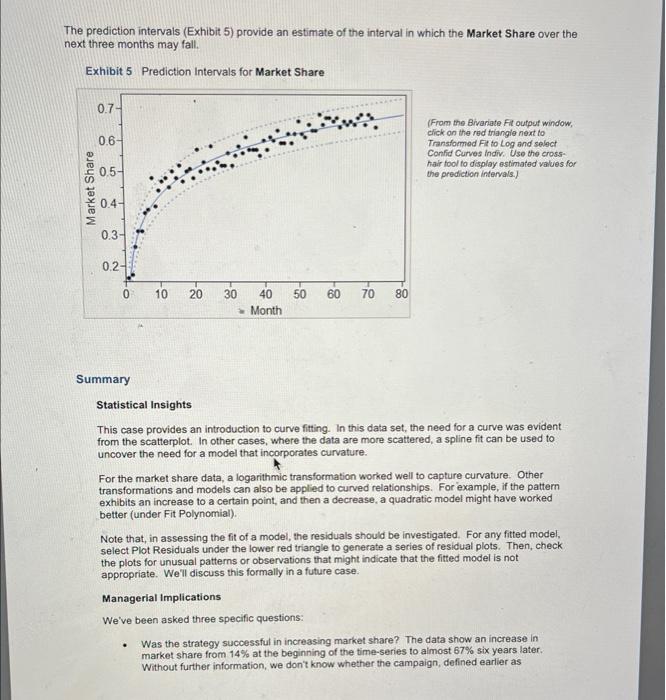
Exhibit 3 Regression with Market Share and Log(Month) (From the Bivariate Fit output window, click on the red triangle nexf to Spline and solect Riemove Fit: Select Fit Special under the lop red trianple. Under X Transformation, solect Natural Loganithm.) Transformed Fat to Log The model forecasts that, over the next three months, the market share will be at around 67% (Exhibit 4). Exhibit 4 Predicted Market Share (Frem the Avariate fie eutput window, click on the red biangle nent to Transformed fit to Log and select 5 are Predicteds to save the prediction fomuta. Enter new monihs in the dada table fo caltudate predicted movet shares for those months) The prediction intervals (Exhibit 5) provide an estimate of the interval in which the Market Share over the next three months may fall. Exhibit 5 Prediction Intervals for Market Share (From the Bivariate Fit output window, click on the red triangle next to Transformed Fir to log and select Confid Curves indiv. Use the cross. hair fool to display estimated values for the prediction intervals.) Summary Statistical Insights This case provides an introduction to curve fitting. In this data set, the need for a curve was evident from the scatterplot. In other cases, where the data are more scattered, a spline fit can be used to uncover the need for a model that incorporates curvature. For the market share data, a logarithmic transformation worked well to capture curvature. Other transformations and models can also be applied to curved relationships. For example, if the pattern exhibits an increase to a certain point, and then a decrease, a quadratic model might have worked better (under Fit Polynomial). Note that, in assessing the fit of a model, the residuals should be investigated. For any fitted model, select Plot Residuals under the lower red triangle to generate a series of residual plots. Then, check the plots for unusual patterns or observations that might indicate that the fitted model is not appropriate. We'll discuss this formally in a future case. Managerial Implications We've been asked three specific questions: - Was the strategy successful in increasing market share? The data show an increase in market share from 14% at the beginning of the time-series to aimost 67% six years later. Without further information, we don't know whether the campaign, defined earlier as Exhibit 1 Regression with Market Share (Y) and Month (X) (Analyze > Fit Y by X. Use Market Share as Y, Response and Month as X, Factor Under the red triangle selact Fit Line) Linear Fit The linear model would be expected to generate inaccurate forecasts of future market share, since the line will grow at a constant rate of 0.49%(0.0049) every month, whereas the data suggest that the growth rate was faster than 0.49% initially, then slower than 0.49% in the later part of the time-series. Extrapolation along the line will generate forecasts that are higher than we should realistically expect. Thus, although the linear model has a statistically significant predictor and a reasonably high R-squared, it's really of limited value because it fails to account for the curved pattern shown in the scatterplot. The flexible spline-fitting in JMP facilitates examination of curved relationships. On the left in Exhibit 2 is a spline with the smallest possible smoothing parameter, lambda =0.000001. Although this choice of Background Sit Well owns several retail furniture stores in a moderate-sized city. After years of disappointing performance, Sit Well hired a new top management team to oversee the firm's business practices. As its first strategic initiative, the management team decided to engage in cost leadership-a strategy of providing affordable high quality products at a lower cost of operation than competitors. To accomplish this goal, a strong advertising campaign was launched, several smaller furniture stores were gradually acquired to increase capacity, and deeply discounted sale prices were promoted. Sit Well's accounting department calculated monthly market share, defined as the percentage of revenue captured by Sit Well relative to estimates of all competing furniture stores in the local market. The Task Assess the effectiveness of this business strategy. - Was the strategy successful in increasing market share? - Is there room for further growth in market share under the current business strategy? - Can you forecast market shares for the next three months? The Data CostLeadership.jmp The data set contains six years of monthlir data, starting with the initiation of the new strategic plan. The variables are: Month Market Share A monthly counter Sit Well's market share (as defined above) that month Analysis The trend analysis shown in Exhibit 1 indicates that market shates have been growing at a rate of 0.49% per month over the last six years, a rate that is statistically significant ( p-value Fit Spline under the fop red trianglo. Enter values in the feld, or use the slider fo dynamically change fambda. Note that a spline fit is also avalable from. Graph > Graph Builder.) Decreasing returns to scale can be modeled by using the logarithm of the variable on the horizontal axis. In Exhibit 3, we re-express, the time variable, Month, as a logarithm. With an R-squared of 0.952 , more of the variation in market share is captured by the logarithmic curve than the straight line model in Exhibit 1. Further, the RMSE has dropped from 5.46%(0.0546) in the linear model to 2.55%(0.0255) in the logarithmic model. Even a simple visual examination tells us that the curve more closely fits the scatter of points than does the line. This model, capturing the curved trend over time, will be used for forecasting future market shares. "providing quality products at a lower cost of operation than competitors", was responsible for the increased market share. Although market share increased notably early in the campaign, expect future increases to be small. - Is there room for further growth in market shares under the current business strategy? The data suggest that a plateau has been reached. Grabbing a larger percentage of the market isn't likely. Brand loyalty to competitors, for example, may make it impossible to capture 100% of the market. Further gains from here on are expected to be slight. - The forecasts of market shares for the next three months, shown in Exhibits 4 and 5, are roughly 67%. The prediction intervals are roughly 62% to 72%. JMP Features and Hints In this case, we used the flexible smoothing spline in Fit Y by X to explore a curved relationship, and Fit Special to fit a model with a log transformation. Note that as of JMP 11, variables can be dynamically transformed in any dialog window. To do this, right-click on the variable in the column selection panel, select Transform and then select the transformation of interest. This creates a temporary variable, which will be shown in italics. To save the transformed data to the data table (and create the formula for the transformation), right-click on the transformed variable and select Add to Data Table. Exercises Suppose that you've invested $400 in a savings bond that earns interest of 3.5% per year. 1. Calculate the value of the bond at the end of years 1 through 40 . Hint: At the end of the first year, the bond is worth $4001.035. At the end of the second year, the bond is worth $400 1.0351.03. 2. In JMP, plot the value of the bond over time. Use Fit Line, Fit Polynomial and Fit Special to find the model that best fits the pattern in the data. 3. Use the best model to predict the value of the bond at the end of year 45


