Help me answer these questions please: 2) Please help me find the three week weighted moving average and Mean Squared Error of the table below
Help me answer these questions please:
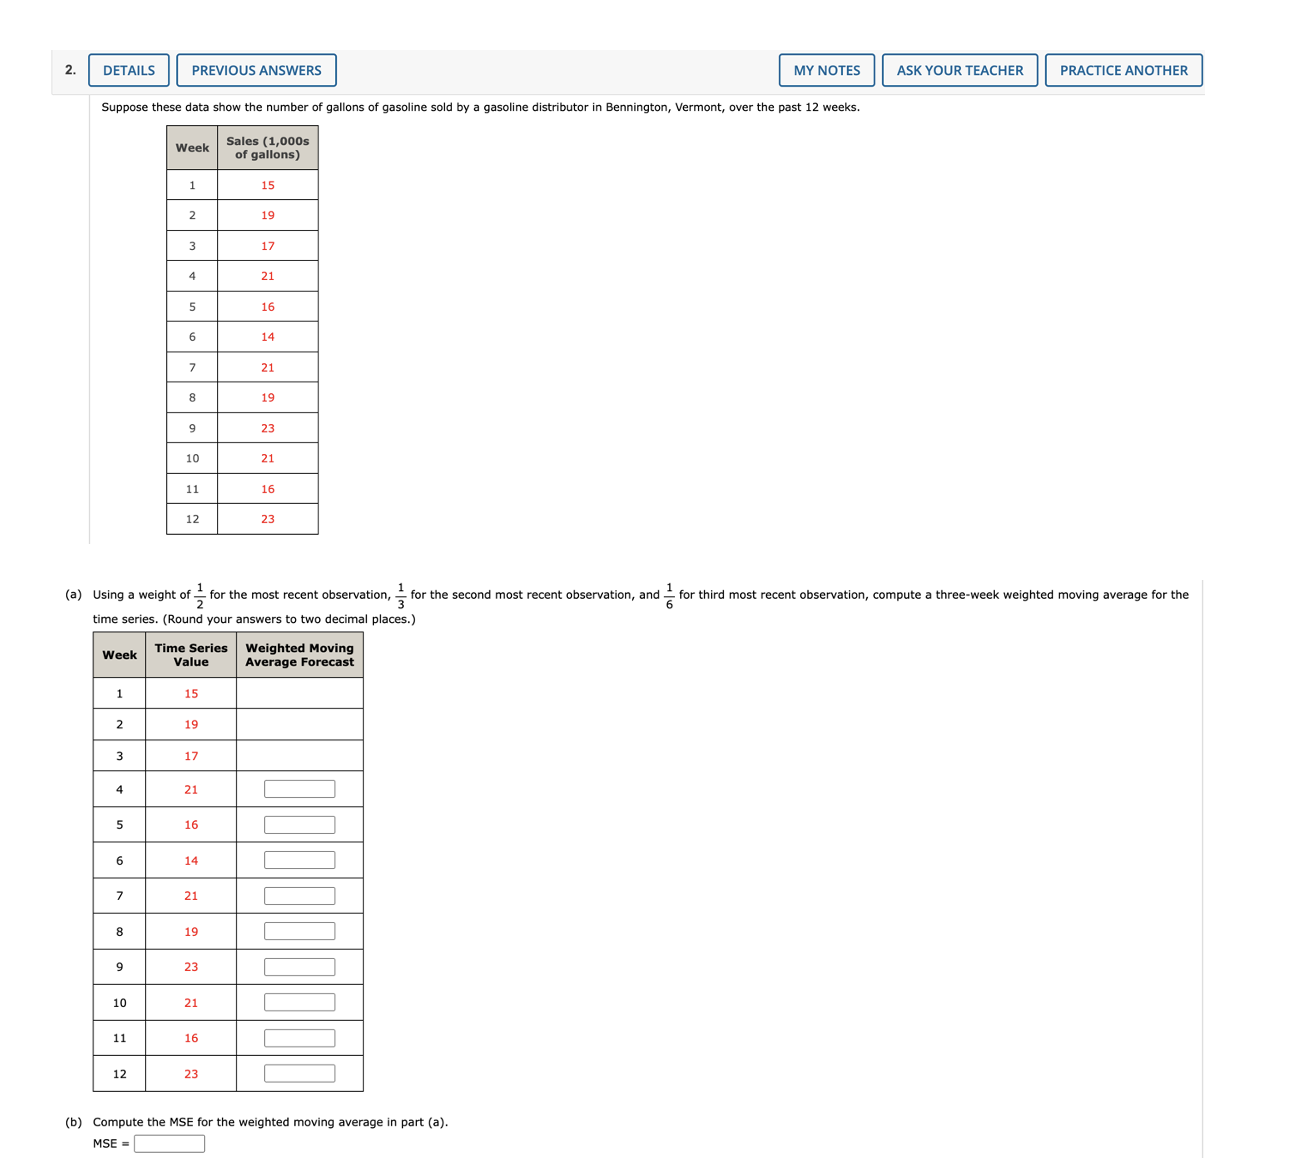
2) Please help me find the three week weighted moving average and Mean Squared Error of the table below
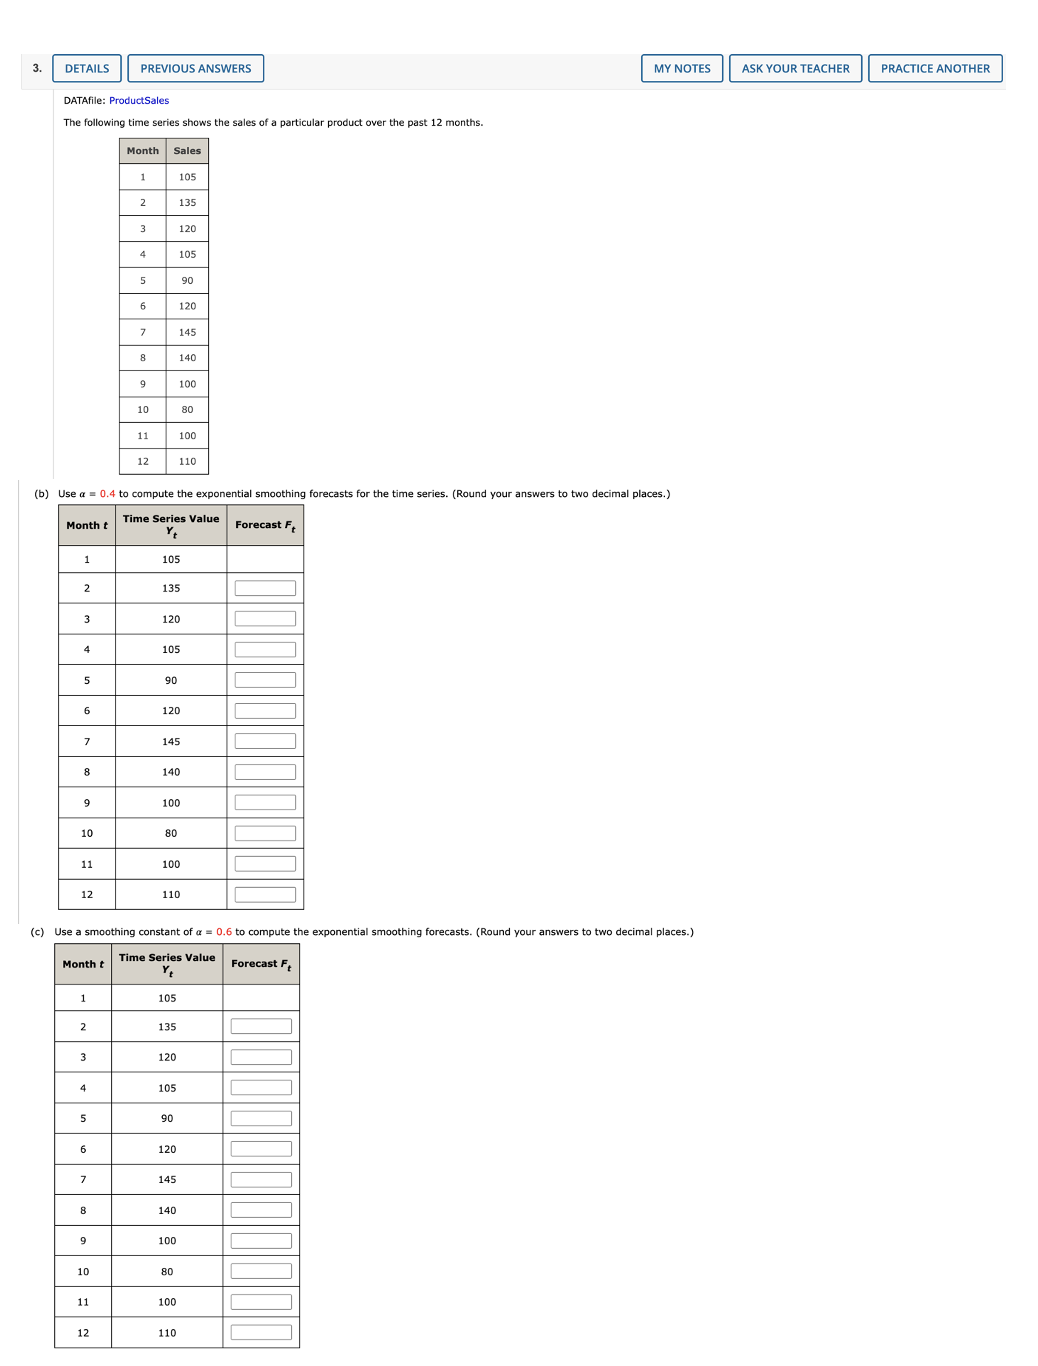
3) Help me compute the exponential smoothing forecasts using a=0.4 and a=0.6 based on the time series table
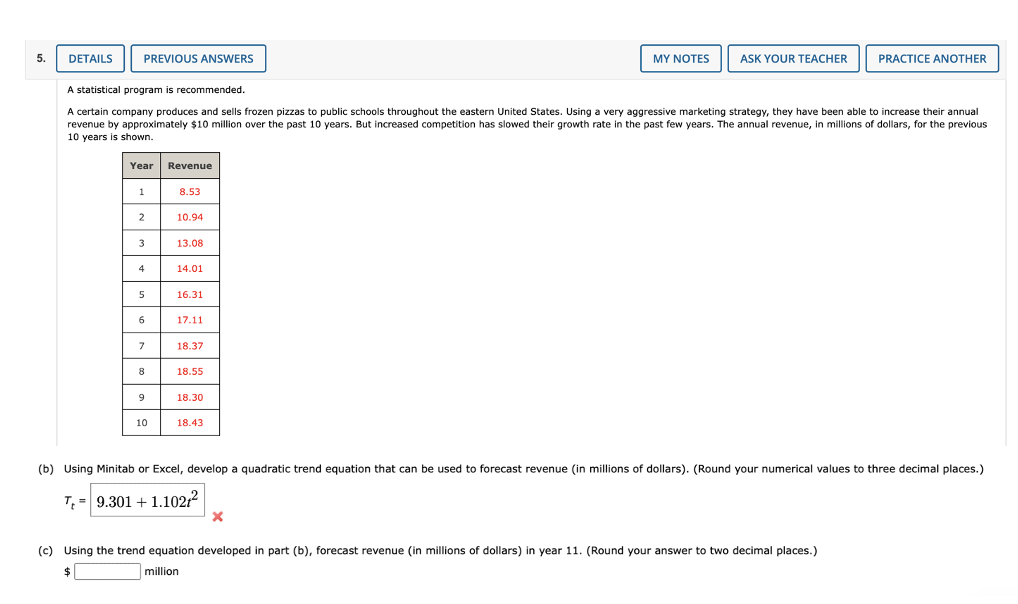
5) Help me find the quadratic equation used to forecast revenue using the table shown.
2. DETAILS PREVIOUS ANSWERS MY NOTES ASK YOUR TEACHER PRACTICE ANOTHER Suppose these data show the number of gallons of gasoline sold by a gasoline distributor in Bennington, Vermont, over the past 12 weeks. Week Sales (1,000 of gallons) 15 2 19 3 17 4 21 5 16 6 14 7 21 8 19 9 23 10 21 11 16 12 23 (a) Using a weight of _ for the most recent observation, - for the second most recent observation, and _ for third most recent observation, compute a three-week weighted moving average for the time series. (Round your answers to two decimal places.) Week Time Series Weighted Moving Value Average Forecast 15 2 19 3 17 21 5 16 5 14 7 21 8 19 g 23 21 11 16 12 23 (b) Compute the MSE for the weighted moving average in part (a). MSE =DETAILS PREVIOUS ANSWERS MY NOTES ASK YOUR TEACHER PRACTICE ANOTHER DATAfile: ProductSales The following time series shows the sales of a particular product over the past 12 months. Month Sales 105 135 3 120 105 5 90 120 145 8 140 9 100 10 80 11 100 12 110 (b) Use a = 0.4 to compute the exponential smoothing forecasts for the time series. (Round your answers to two decimal places.) Month t Time Series Value Y - Forecast F 105 135 3 120 105 5 90 6 120 7 145 8 140 100 10 80 11 100 12 110 (c) Use a smoothing constant of a = 0.6 to compute the exponential smoothing forecasts. (Round your answers to two decimal places.) Month t Time Series Value Forecast F 105 2 135 3 120 105 5 90 6 120 7 145 8 140 9 100 10 80 11 100 12 1105. DETAILS PREVIOUS ANSWERS MY NOTES ASK YOUR TEACHER PRACTICE ANOTHER A statistical program is recommended. A certain company produces and sells frozen pizzas to public schools throughout the eastern United States. Using a very aggressive marketing strategy, they have been able to increase their annual revenue by approximately $10 million over the past 10 years. But increased competition has slowed their growth rate in the past few years. The annual revenue, in millions of dollars, for the previous 10 years is shown. Year Revenue 1 8.53 10.94 13.08 14.01 16.31 17.11 18.37 18.55 18.30 10 18.43 (b) Using Minitab or Excel, develop a quadratic trend equation that can be used to forecast revenue (in millions of dollars). (Round your numerical values to three decimal places.) T = 9.301 + 1.102/2 x (c) Using the trend equation developed in part (b), forecast revenue (in millions of dollars) in year 11. (Round your answer to two decimal places.) $ million
Step by Step Solution
There are 3 Steps involved in it
Step: 1
Get Instant Access to Expert-Tailored Solutions
See step-by-step solutions with expert insights and AI powered tools for academic success
Step: 2
Step: 3
Ace Your Homework with AI
Get the answers you need in no time with our AI-driven, step-by-step assistance