Thanks in advance:-
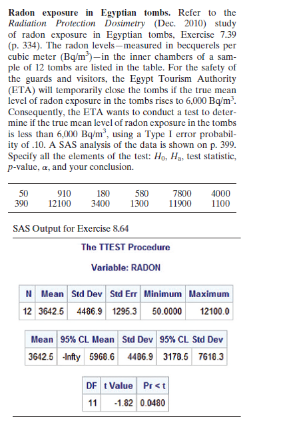
Radon exposure in Egyptian tombs, Refer to the Radiation Protection Dosimetry (Dec. 2010) study of radon exposure in Egyptian tombs. Exercise 7.39 (p. 334). The radon levels-measured in becquerels per cubic meter (Bqim )-in the inner chambers of a sam- ple of 12 tombs are listed in the table, For the safety of the guards and visitors, the Egypt Tourism Authority (ETA) will temporarily close the tombs if the true mean level of radon exposure in the tombs rises to 6.000 Bq/m'. Consequently, the ETA wants to conduct a test to deter- mine if the true mean level of radon exposure in the tombs is less than 6,000 Bq/m , using a Type I error probabil- ity of .10. A SAS analysis of the data is shown on p. 399. Specify all the elements of the test: Ho, He, test statistic, p-value, a, and your conclusion. 50 910 180 580 7800 4000 390 12100 3400 1310 11900 1100 SAS Output for Exercise 8.64 The TTEST Procedure Variable: RADON Mean Sid Day Sid Err Minimum Maximum 12 3642 5 4486.9 1295 3 50.0000 12100.0 Mean 95% CL Mean Std Dev 95% CL Std Dev 3642.5 -Infty 5960.6 1406.9 3170.5 7610.3 t Value Pre t 11 -1.82 0 0480Yield strength of steel connecting bars. To protect against earthquake damage, steel beams are typically fitted and connected with plastic hinges. However, these plastic hinges are prone to deformations and are difficult to inspect and repair. An alternative method of connecting steel beams-one that uses high-strength steel bars with clamps-was investigated in Engineering Structures (July 2013). Mathematical models for predicting the performance of these steel connecting bars assume the bars have a mean yield strength of 300 megapascals (MPa). To verify this assumption, the researchers conducted material property tests on the steel connecting bars. In a sample of three tests, the yield strengths were 354. 370, and 350 MPa. Do the data indicate that the true mean yield strength of the steel bars exceeds 300 MPa? Test using or - ,01.70Pitch memory of amusiacs. Amusis is a congenital disorder that adversely impacts one's perception of music. Refer to the Advances in Cognitive Psychology (Vol. 8. 2010) study of the pitch memory of individuals diagnosed with amusia, Exercise. Recall that each in a sample of 17 amusiacs listened to a series of tone pairs and was asked to determine if the tones were the same or different. In the first trial, the tones were separated by 1 second; in a second trial, the tones were separated by 5 seconds. The difference in accuracy scores for the two trials was determined for each amusiac (where the difference is the score on the first trial minus the score on the second trial. The mean score difference was .11 with a standard deviation of .19. a. In theory, the longer the delay between tones, the less likely one is to detect a difference between the tones. Consequently, the true mean score difference should exceed 0. Set up the null and alternative hypotheses for testing the theory. b. Carry out the test, part a, using a = .05 . Is there evidence to support the theory?Free recall memory strategy. Psychologists who study memory often use a measure of free recall(e.g., the number of correctly recalled items in a list of to-be remembered items). The strategy used to memorize the list-for example, category clustering-is often just as important. Researchers at Central Michigan University developed an algorithm for computing measures of category clustering in Advances in Cognitive Psychology (Oct. 2012). One measure, called ratio of repetition, was recorded for a sample of 8 participants in a memory study. These ratios are listed in the table. Test the theory that the average ratio of repetition for all participants in a similar memory study differs from .5. Select an appropriate Type I error rate for your test. .25 .43 .57 .3.8 .47 30 Source. Senlova, 0., & Oiani, H. "Calcpary clustering calculator for face recall" Advances in Cognitive Paychelogy Vol B. Na. 4. Oct 2012 (Table ]).Increasing hardness of polyester composites. Polyester resins reinforced with fiberglass are used to fabricate wall panels of restaurants. It is theorized that adding cement kiln dust (CKD) to the polyester composite will increase wall panel hardness. In a study published in Advances in Applied Physics (Vol. 2. 2014). hardness (joules per squared centimeters) was determined for three polyester composite mixtures that used a 40% CKD weight ratio. The hardness values were reported as 83. 84, and 79 jom Research has shown that the mean hardness value of polyester composite mixtures that use a 20% CKD weight ratio is p - 76j/em In your opinion. does using a 40% CKD weight ratio increase the mean hardness value of polyester composite mixtures? Support your answer statistically.Minimizing tractor skidding distance. Refer to the Journal of Forest Engineering (July 1999) study of minimizing tractor skidding distances along a new road in a European forest. The skidding distances (in meters) were measured at 20 randomly selected road sites. The data (saved in the SKIDDING file) are repeated in the accompanying table. Recall that a logger working on the road claims that the mean skidding distance is at least 425 meters. Is there sufficient evidence to refute this claim? Use a = .10. 488 350 | 457 109 285 409 435 574 439 546 385 205 184 261 273 400 311 |312 141 |425 Based on Tujek, J. and Pacola, E. "Algorithms for skidding distance modeling on a raster Digital Terrain Model." Joumal of Forest Engineering . Vol 10, No. 1. July 1999. Conclusions and Consequences for a Test of Hypothesis True State of Nature Conclusion HO True Ha True Correct decision Accept HO (Assume HO True) Reject HO Type II error (probability 5) (Assume Ha True) Type I error Correct decision (probability a)Dissolved organic compound in lakes. The level of dissolved oxygen in the surface water of a lake is vital to maintaining the lake's ecosystem. Environmentalists from the University of Wisconsin monitored the dissolved oxygen levels over time for a sample of 25 lakes in the state (Aquatic Biology, May 2010). To ensure a representative sample, the environmentalists focused on several lake characteristics, including dissolved organic compound (DOC). The DOC data (measured in grams per cubic meters) for the 25 lakes are listed in the table on p. 400. The population of Wisconsin lakes has a mean DOC value of 15 grams/m . Use a hypothesis test (at " = .10) to make an inference about whether the sample is representative of all Wisconsin lakes for the characteristic dissolved organic compound Data for Exercise 8.70 Lake DOC Allequash 9.6 Hip Muskellunge 4.5 Hrown 13.2 Crampton 4.1 Cranberry Bog 22.6 Crystal 2.7 FasiLong 14.7 Helmet 3.5 Hiawatha 13.6 Hummingbird 19.8 Kickapoo 14.3 Little Arbor Vitae 56.9 Mary 25.1 Muskellunge Northgate Bog 2.7 Paul 4.2 Peter 30.2 Plum 10.3 Reddington Bog 17.6 Sparkling 24 Tenderfoot 17.3 Trout Bog 38.8 Trout Lake 3.0 Ward 5.8 West Long 7.6 Hasad on Langman, Q C, cial "Control of dissolved anygen in northern temperate lakes over wakes ranging from minutes In days" Aquatic Biology, Vol 9, May 2010 (Table 1).Walking straight into circles. When people get lost in unfamiliar terrain, do they really walk in circles, as is commonly believed? To answer this question, researchers conducted a field experiment and reported the results in Current Biology (Sept. 20, 2000). Fifteen volunteers were blindfolded and asked to walk as straight as possible in a certain direction in a large field. Walking trajectories were monitored every second for 50 minutes using GPS and the average directional bias (degrees per second) recorded for each walker. The data, saved in the CIRCLES file, are shown in the table (next column). A strong tendency to veer consistently in the same direction will cause walking in circles. A mean directional bias of 0 indicates that walking One-Sample T. BIAS trajectories were Variable Mean SoDev SE Mean 954 CI I F BIAS 0.085 1.603 0. 414 1-0.902, 0.972) 0.21 0.410 random. Consequently, the researchers tested whether the true mean bias differed significantly from 0. A MINITAB printout of the analysis is shown below. a. Interpret the results of the hypothesis test for the researchers. Use o = .10 b. Although most volunteers showed little overall bias, the researchers produced maps of the walking paths showing that each occasionally made several small circles during the walk. Ultimately, the researchers supported the "walking into circles" theory. Explain why the data in the table is insufficient for testing whether an individual walks into circles -4.50 -1.00 -0.50 -0.15 0.00 0.01 0.02 0.05 0.15 0.20 0.50 0.50 1.00 2.00 3.00 Based on Souman, J. L., Frissen, I., Sreenivasa, M. N., and Ernst, M. O. "Walking straight into circles." Current Biology , Vol. 19, No. 18. Sept. 29, 2009 (Figure 2).Lengths of great white sharks. One of the most fearedpredators in the ocean is the great white shark. It is knownthat the white shark grows to a mean length of 21 feet;however, one marine biologist believes that great whitesharks off the Bermuda coast grow much longer owing tounusual feeding habits. To test this claim, some full-growngreat white sharks were captured off the Bermuda coast, measured, and then set free. However, because the captureof sharks is difficult, costly, and very dangerous, only threespecimens were sampled. Their lengths were 24. 20, and 22feet. Do these data support the marine biologist's claim ato = .10?For the binomial sample sizes and null-hypothesized values of p in each part, determine whether the sample size is large enough to use the normal approximation methodology presented in this section to conduct a test of the null hypothesis HD: p = p0. a. n = 500, p0 =.05 b. n = 100, p0 =.99 c. n = 50, p0 =.2 d. n = 20, p0 =.2 e. n = 10, p0 =.4Suppose a random sample of 100 observations from a binomial population gives a value of p =.60 and you wish to test the null hypothesis that the population parameter p is equal to.75 against the alternative hypothesis that p is less than.75. a. Noting that p =.80, what does your intuition tell you? Does the value of p appear to contradict the null hypothesis? b. Use the large-sample z-test to test HO: p =.75 against the alternative hypothesis Ha: p<.75. use d=".05." how do the test results compare with your intuitive decision from part a c. find and interpret observed significance level of you conducted in b.suppose sample exercise has produced we wish to ho: p=".9" against alternative ha: a. calculate value z statistic for this test. b. note that numerator p0=".84" is same as considering why absolute larger than calculated complete using result. d. its>