help me in this problems
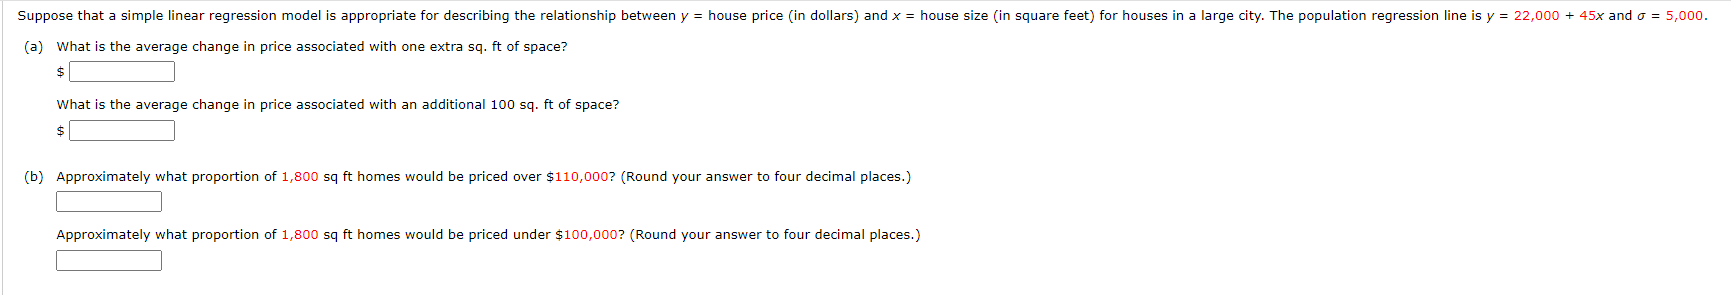
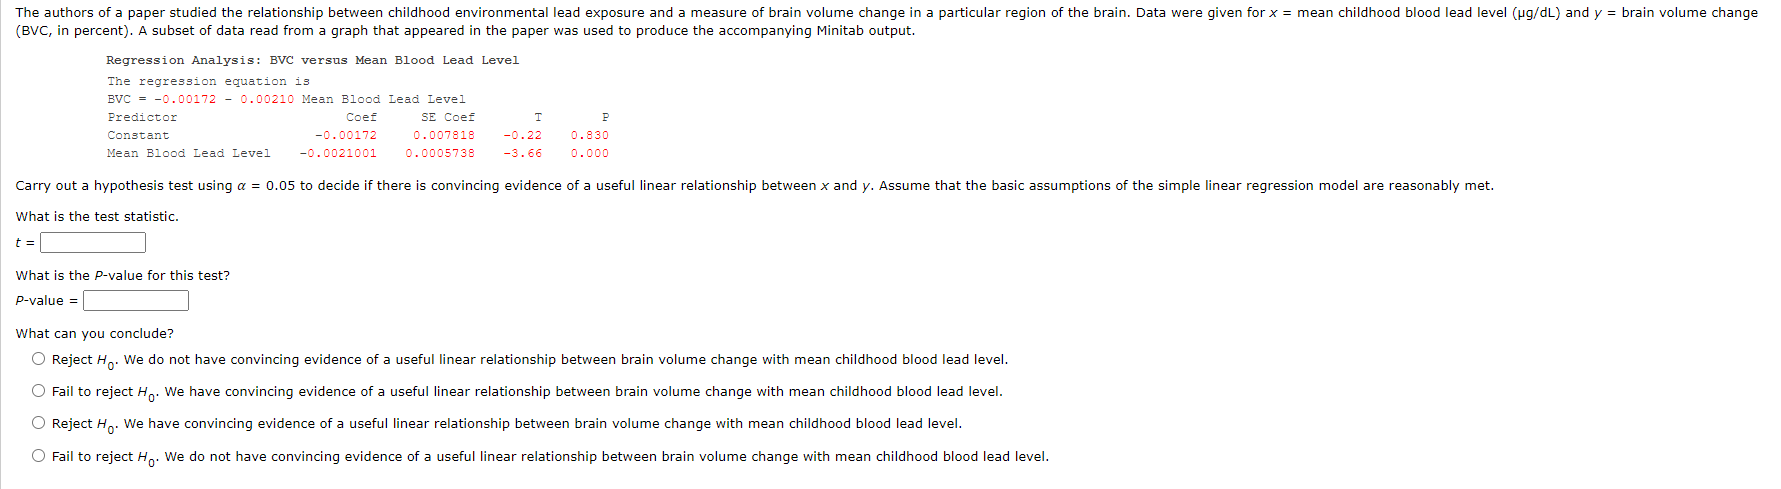
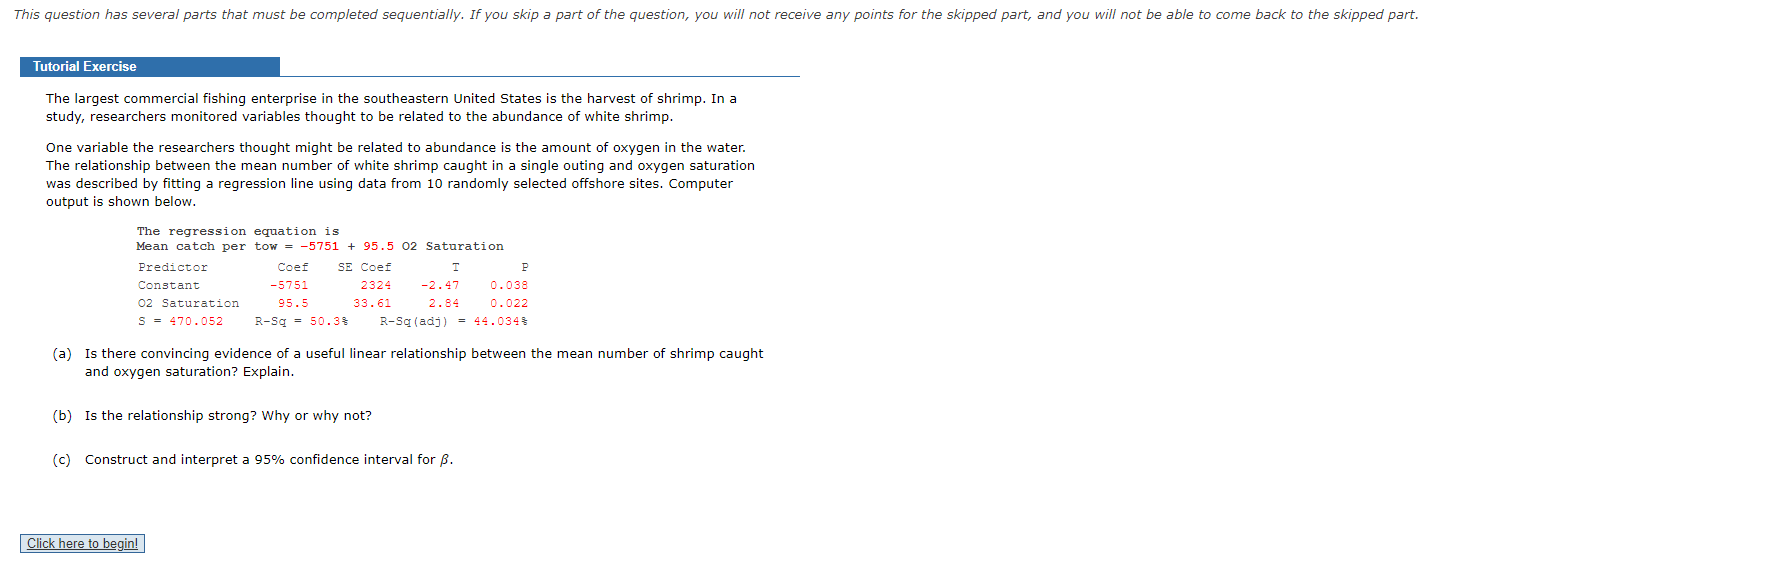
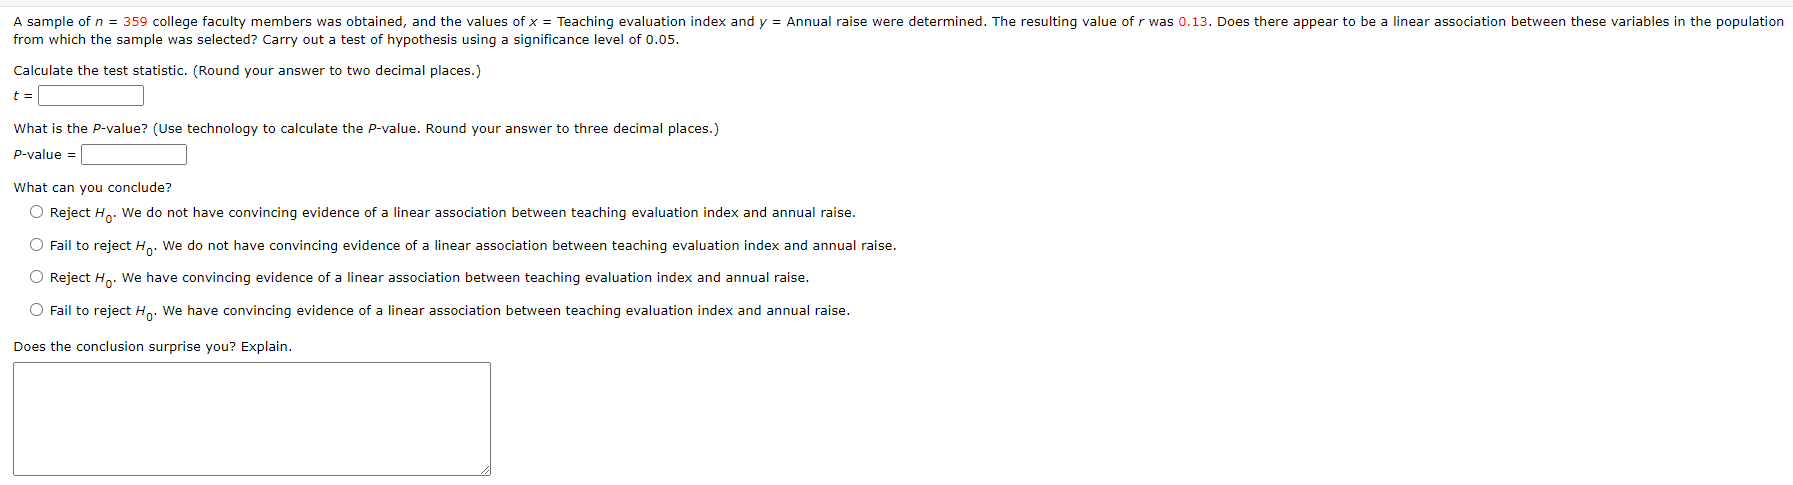
Suppose that a simple linear regression model is appropriate for describing the relationship between y = house price (in dollars) and x = house size (in square feet) for houses in a large city. The population regression line is y = 22,000 + 45x and o = 5,000. (a) What is the average change in price associated with one extra sq. ft of space? $ What is the average change in price associated with an additional 100 sq. ft of space? $ (b) Approximately what proportion of 1,800 sq ft homes would be priced over $110,000? (Round your answer to four decimal places.) Approximately what proportion of 1,800 sq ft homes would be priced under $100,000? (Round your answer to four decimal places.)The authors of a paper studied the relationship between childhood environmental lead exposure and a measure of brain volume change in a particular region of the brain. Data were given for x = mean childhood blood lead level (ug/dL) and y = brain volume change (BVC, in percent). A subset of data read from a graph that appeared in the paper was used to produce the accompanying Minitab output. Regression Analysis: BVC versus Mean Blood Lead Level The regression equation is BVC = -0. 00172 - 0. 00210 Mean Blood Lead Level Predictor Coef SE Coef P Constant -0. 00172 0 . 007818 -0. 22 0. 830 Mean Blood Lead Level -0. 0021001 0. 0005738 -3.66 0.000 Carry out a hypothesis test using a = 0.05 to decide if there is convincing evidence of a useful linear relationship between x and y. Assume that the basic assumptions of the simple linear regression model are reasonably met. What is the test statistic. t = What is the P-value for this test? P-value = What can you conclude? O Reject Ho. We do not have convincing evidence of a useful linear relationship between brain volume change with mean childhood blood lead level. O Fail to reject Ho. We have convincing evidence of a useful linear relationship between brain volume change with mean childhood blood lead level. O Reject Ho. We have convincing evidence of a useful linear relationship between brain volume change with mean childhood blood lead level. O Fail to reject Ho. We do not have convincing evidence of a useful linear relationship between brain volume change with mean childhood blood lead level.This question has several parts that must be completed sequentially. If you skip a part of the question, you will not receive any points for the skipped part, and you will not be able to come back to the skipped part. Tutorial Exercise The largest commercial fishing enterprise in the southeastern United States is the harvest of shrimp. In a study, researchers monitored variables thought to be related to the abundance of white shrimp. One variable the researchers thought might be related to abundance is the amount of oxygen in the water. The relationship between the mean number of white shrimp caught in a single outing and oxygen saturation was described by fitting a regression line using data from 10 randomly selected offshore sites. Computer output is shown below. The regression equation is Mean catch per tow = -5751 + 95.5 02 Saturation Predictor Coef SE Coef T P Constant -5751 2324 -2. 47 0. 038 02 Saturation 95.5 33 . 61 2. 84 0. 022 S = 470 . 052 R-Sq = 50.34 R-Sq (adj) = 44.034 (a) Is there convincing evidence of a useful linear relationship between the mean number of shrimp caught and oxygen saturation? Explain. (b) Is the relationship strong? Why or why not? (c) Construct and interpret a 95% confidence interval for B. Click here to begin!A sample of n = 359 college faculty members was obtained, and the values of x = Teaching evaluation index and y = Annual raise were determined. The resulting value of r was 0.13. Does there appear to be a linear association between these variables in the population from which the sample was selected? Carry out a test of hypothesis using a significance level of 0.05. Calculate the test statistic. (Round your answer to two decimal places.) t = What is the P-value? (Use technology to calculate the P-value. Round your answer to three decimal places.) P-value = What can you conclude? O Reject Ho. We do not have convincing evidence of a linear association between teaching evaluation index and annual raise. Fail to reject Ho. We do not have convincing evidence of a linear association between teaching evaluation index and annual raise. O Reject Ho. We have convincing evidence of a linear association between teaching evaluation index and annual raise. O Fail to reject Ho. We have convincing evidence of a linear association between teaching evaluation index and annual raise. Does the conclusion surprise you? Explain.If the sample correlation coefficient is equal to 1, is it necessarily true that p = 1? O Yes O No If p = 1, is it necessarily true that r = 1? O Yes O No