Answered step by step
Verified Expert Solution
Link Copied!

Question

1 Approved Answer

I need help constructing a boxplot for the data below and I need help answering these subquestions this is for the average question: What's the

I need help constructing a boxplot for the data below and I need help answering these subquestions this is for the average question: What's the average number of spring quarter units for a De Anza student?

Data: 26 25.5 25 25 24 21 21 21 21 21 21 21 20 20 20 20 20 20 19.5 19.5 19 19 19 19 19 19 19 19 19 19 19 19 19 19 19 19 19 18.5 18.5 18 18 18 18 18 18 18 18 18 17 17 17 17 17 16 16 16 16 16 16 15 15 15 15 15 15 15 15 15 15 15 15 15 15 15 15 15 14.5 14 14 14 14 14 14 14 14 14 14 14 14 14 14 14 14 14 14 14 14 14 14 14 14 13 13 13 13 13 13 13 13 12 12 12 12 12 12 11 10 10 10 9.5 9 9 9 9 8 7 5 5 5
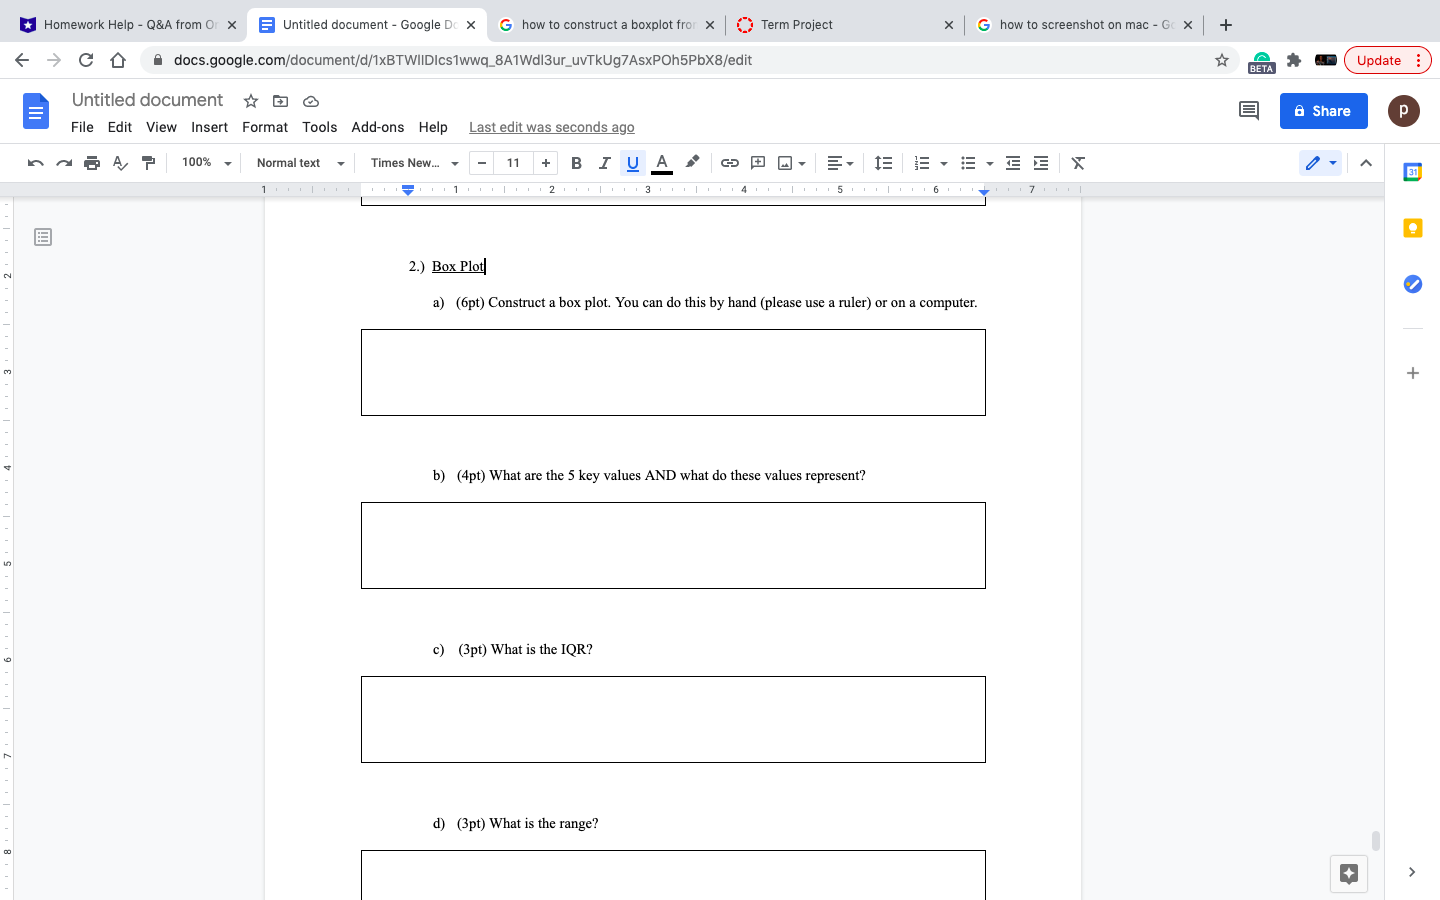
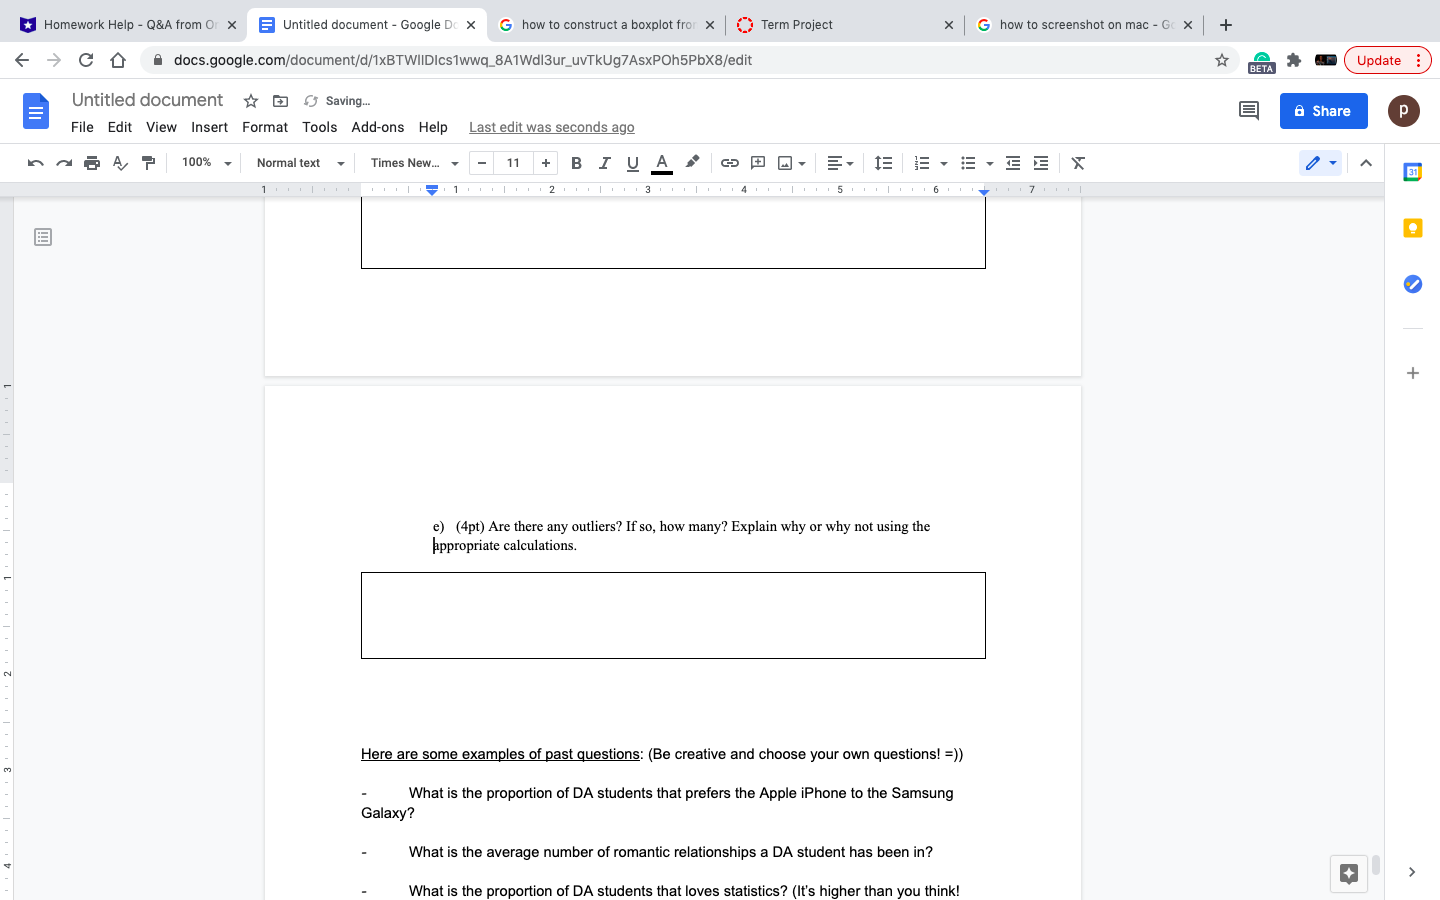
image text in transcribedimage text in transcribed
Homework Help - Q&A from Or x E Untitled document - Google Do x G how to construct a boxplot fror x Term Project x G how to screenshot on mac - Gc X + C D A docs.google.com/document/d/1xBTWIIDics1wwq_8A1Wdl3ur_uvTkug7AsxPOh5PbX8/edit BETA Update : Untitled document * d Share File Edit View Insert Format Tools Add-ons Help Last edit was seconds ago In a $ A 7 100% Normal text Times New... * - 11 + BIU ACHEBE BEE 31 2.) Box Plot a) (6pt) Construct a box plot. You can do this by hand (please use a ruler) or on a computer. + b) (4pt) What are the 5 key values AND what do these values represent? c) (3pt) What is the IQR? d) (3pt) What is the range? +Homework Help - Q&A from Or x Untitled document - Google Do x G how to construct a boxplot fror x Term Project x G how to screenshot on mac - Gc X + > C D A docs.google.com/document/d/1xBTWIIDIcs1wwq_8A1Wdl3ur_uvTkug7AsxPOh5PbX8/edit BETA Update : Untitled document * Saving. d Share File Edit View Insert Format Tools Add-ons Help Last edit was seconds ago In a $ A 7 100% Normal text Times New.. * - 11 + B JU AGO= BEE BEE X 31 + e) (4pt) Are there any outliers? If so, how many? Explain why or why not using the Appropriate calculations. Here are some examples of past questions: (Be creative and choose your own questions! =)) What is the proportion of DA students that prefers the Apple iphone to the Samsung Galaxy? What is the average number of romantic relationships a DA student has been in? + What is the proportion of DA students that loves statistics? (It's higher than you think

Step by Step Solution

There are 3 Steps involved in it

Step: 1

blur-text-image

Get Instant Access to Expert-Tailored Solutions

See step-by-step solutions with expert insights and AI powered tools for academic success

Step: 2

blur-text-image

Step: 3

blur-text-image

Ace Your Homework with AI

Get the answers you need in no time with our AI-driven, step-by-step assistance

Get Started

Recommended Textbook for

Precalculus Enhanced With Graphing Utilities (Subscription)

Authors: Michael, Michael Sullivan III, Michael III Sullivan, III Sullivan

6th Edition

0321849108, 9780321849106

More Books

Students also viewed these Mathematics questions