Answered step by step
Verified Expert Solution
Link Copied!

Question

1 Approved Answer

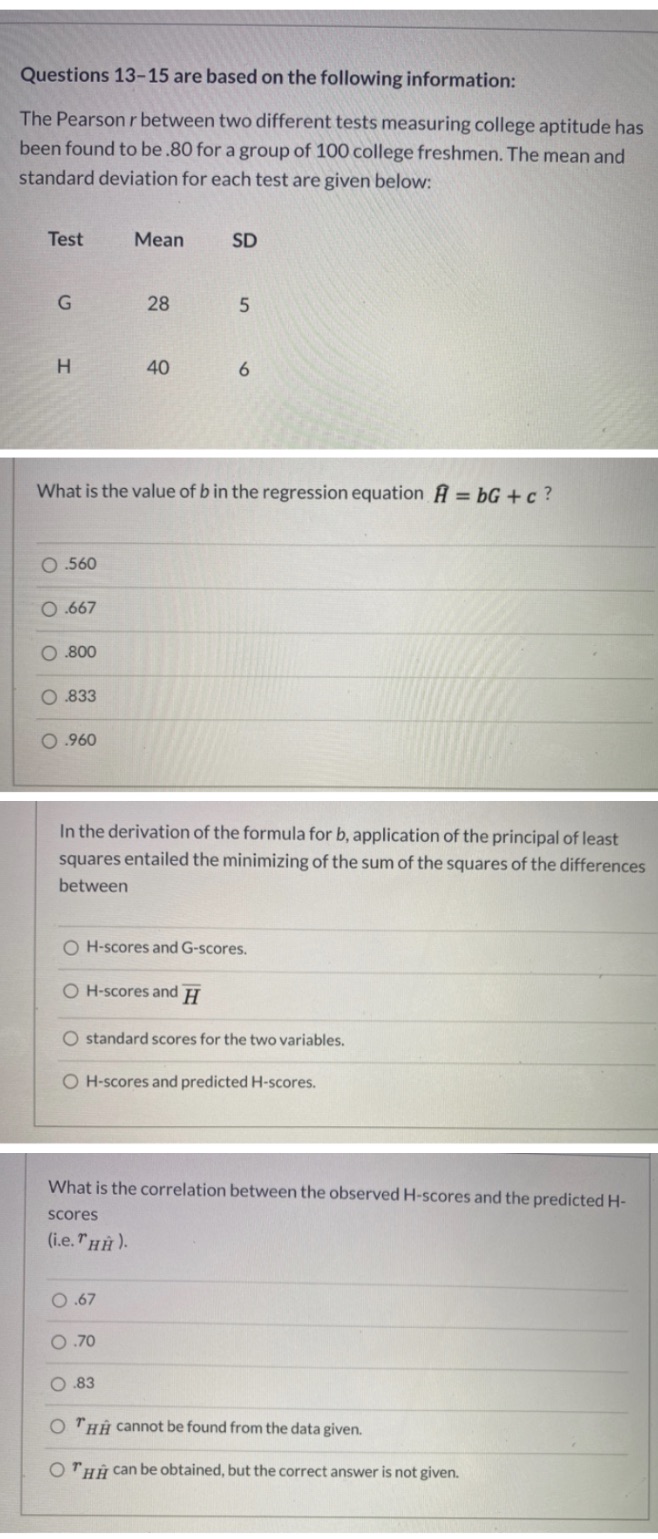
HELP ME PLEASE Questions 13-15 are based on the following information: The Pearson r between two different tests measuring college aptitude has been found to

HELP ME PLEASE

image text in transcribed
Questions 13-15 are based on the following information: The Pearson r between two different tests measuring college aptitude has been found to be .80 for a group of 100 college freshmen. The mean and standard deviation for each test are given below: Test Mean SD G 28 5 H 40 6 What is the value of b in the regression equation A = bG + c ? O .560 O .667 O .800 O .833 O.960 In the derivation of the formula for b, application of the principal of least squares entailed the minimizing of the sum of the squares of the differences between O H-scores and G-scores. O H-scores and H standard scores for the two variables. O H-scores and predicted H-scores. What is the correlation between the observed H-scores and the predicted H- scores (i.e. HH ). O .67 O .70 O .83 O THE cannot be found from the data given. O T HA can be obtained, but the correct answer is not given

Step by Step Solution

There are 3 Steps involved in it

Step: 1

blur-text-image

Get Instant Access to Expert-Tailored Solutions

See step-by-step solutions with expert insights and AI powered tools for academic success

Step: 2

blur-text-image

Step: 3

blur-text-image

Ace Your Homework with AI

Get the answers you need in no time with our AI-driven, step-by-step assistance

Get Started

Recommended Textbook for

Linear Algebra A Modern Introduction

Authors: David Poole

3rd edition

9781133169574 , 978-0538735452

More Books

Students also viewed these Mathematics questions