

Answered step by step
Verified Expert Solution
Question
1 Approved Answer
help me question 2 questions. Please make sure to provide tab labels for each worksheet. Answer all questions. 1. Google stock price data is provided
help me question 2 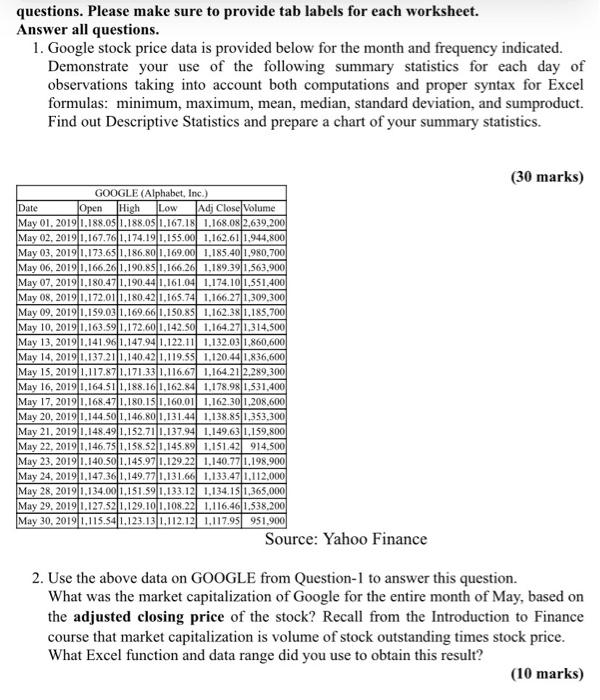 questions. Please make sure to provide tab labels for each worksheet. Answer all questions. 1. Google stock price data is provided below for the month and frequency indicated. Demonstrate your use of the following summary statistics for each day of observations taking into account both computations and proper syntax for Excel formulas: minimum, maximum, mean, median, standard deviation, and sumproduct. Find out Descriptive Statistics and prepare a chart of your summary statistics. (30 marks) GOOGLE (Alphabet, Inc.) Date Open High Low Adj Close Volume May 01. 2019 1.188.05 1.188.05 1.167.18 1.168.08 2.639.200 May 02, 2019 1.167.761,174.19 1.155.00 1.162.61 1.944.800 May 03, 2019 1.173.65 1.186.80 1.169.00 1.185.401.980.700 May 06, 20191,166.20 1.190.85|1,166.26 1,189.39|1,563.900 May 07. 2019 1.180.471.190.441.161.04 1.174.101,551,400 May 08, 20191.172.01 1.180.42 1.165.74 1.166.271,309,300 May 09. 2019 1.159.03|1.169.661.150.85 1.162.38|1.185.700 May 10, 2019 1.163.591.172.60 1.142.50 1.164.271.314.500 May 13, 20191.141.96 1.147.941.122.11 1.132,031,860,600 May 14, 2019 1.137.21 1.140.42 1.119.55 1.120.441.836,600 May 15, 2019 1,117.87 1.171.33 1.116.67 1.164.21 2.289,300 May 16, 20191.164.511.188.161.162.84 1.178.981,531,400 May 17, 2019 1.168.47 1.180.15 1.160.01 1.162.30 1.208.600 May 20, 20191.144.50 1.146.80 1.131.44 1.138.851,353,300 May 21, 2019 1.148.49 1.152.71 1.137.94 1.149.63|1.159,800 May 22, 2019 1.146.75 1.158.521.145.89 1.151.42 914,500 May 23. 20191.140.50|1.145.971.129.22 1.140.771.198.900 May 24, 2019 1.147.361.149.77|1.131.66 1,133.471.112.000 May 28, 20191.134.00 1.151.591.133.12 1,134.151,365,000 May 29, 2019 1.127.32 1.129.10 1.108.22 1.116.46 1.538.200 May 30, 2019 1.115.54 1.123.131.112.12 1.117.95 951,900 Source: Yahoo Finance 2. Use the above data on GOOGLE from Question-1 to answer this question. What was the market capitalization of Google for the entire month of May, based on the adjusted closing price of the stock? Recall from the Introduction to Finance course that market capitalization is volume of stock outstanding times stock price. What Excel function and data range did you use to obtain this result? (10 marks) questions. Please make sure to provide tab labels for each worksheet. Answer all questions. 1. Google stock price data is provided below for the month and frequency indicated. Demonstrate your use of the following summary statistics for each day of observations taking into account both computations and proper syntax for Excel formulas: minimum, maximum, mean, median, standard deviation, and sumproduct. Find out Descriptive Statistics and prepare a chart of your summary statistics. (30 marks) GOOGLE (Alphabet, Inc.) Date Open High Low Adj Close Volume May 01. 2019 1.188.05 1.188.05 1.167.18 1.168.08 2.639.200 May 02, 2019 1.167.761,174.19 1.155.00 1.162.61 1.944.800 May 03, 2019 1.173.65 1.186.80 1.169.00 1.185.401.980.700 May 06, 20191,166.20 1.190.85|1,166.26 1,189.39|1,563.900 May 07. 2019 1.180.471.190.441.161.04 1.174.101,551,400 May 08, 20191.172.01 1.180.42 1.165.74 1.166.271,309,300 May 09. 2019 1.159.03|1.169.661.150.85 1.162.38|1.185.700 May 10, 2019 1.163.591.172.60 1.142.50 1.164.271.314.500 May 13, 20191.141.96 1.147.941.122.11 1.132,031,860,600 May 14, 2019 1.137.21 1.140.42 1.119.55 1.120.441.836,600 May 15, 2019 1,117.87 1.171.33 1.116.67 1.164.21 2.289,300 May 16, 20191.164.511.188.161.162.84 1.178.981,531,400 May 17, 2019 1.168.47 1.180.15 1.160.01 1.162.30 1.208.600 May 20, 20191.144.50 1.146.80 1.131.44 1.138.851,353,300 May 21, 2019 1.148.49 1.152.71 1.137.94 1.149.63|1.159,800 May 22, 2019 1.146.75 1.158.521.145.89 1.151.42 914,500 May 23. 20191.140.50|1.145.971.129.22 1.140.771.198.900 May 24, 2019 1.147.361.149.77|1.131.66 1,133.471.112.000 May 28, 20191.134.00 1.151.591.133.12 1,134.151,365,000 May 29, 2019 1.127.32 1.129.10 1.108.22 1.116.46 1.538.200 May 30, 2019 1.115.54 1.123.131.112.12 1.117.95 951,900 Source: Yahoo Finance 2. Use the above data on GOOGLE from Question-1 to answer this question. What was the market capitalization of Google for the entire month of May, based on the adjusted closing price of the stock? Recall from the Introduction to Finance course that market capitalization is volume of stock outstanding times stock price. What Excel function and data range did you use to obtain this result? (10 marks)
help me question 2
Step by Step Solution
There are 3 Steps involved in it
Step: 1

Get Instant Access to Expert-Tailored Solutions
See step-by-step solutions with expert insights and AI powered tools for academic success
Step: 2

Step: 3
Ace Your Homework with AI
Get the answers you need in no time with our AI-driven, step-by-step assistance
Get Started
Quantitative Analysis For Management
Authors: Barry Render, Ralph M. Stair, Michael E. Hanna, Trevor S. Hale
14th Edition
0137943601, 9780137943609