Answered step by step
Verified Expert Solution
Link Copied!

Question

1 Approved Answer

help me to solve Q-1: [4+6+8+2 Marks] the data shown here represent the number of hours that 12 part-time employees at a toy store worked

help me to solve
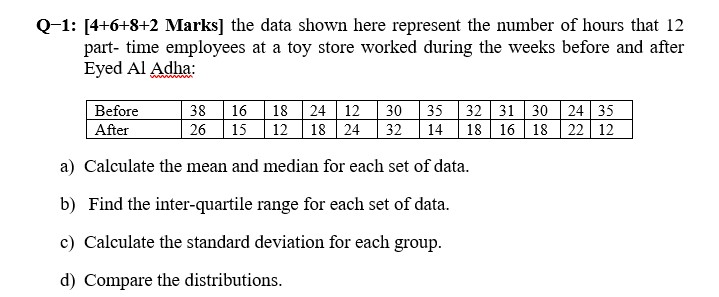
image text in transcribed
Q-1: [4+6+8+2 Marks] the data shown here represent the number of hours that 12 part-time employees at a toy store worked during the weeks before and after Eyed Al Adha: Before 38 16 18 24 12 30 35 32 31 30 24 35 After 26 15 12 18 24 32 14 18 16 18 22 12 a) Calculate the mean and median for each set of data. b) Find the inter-quartile range for each set of data. c) Calculate the standard deviation for each group. d) Compare the distributions

Step by Step Solution

There are 3 Steps involved in it

Step: 1

blur-text-image

Get Instant Access to Expert-Tailored Solutions

See step-by-step solutions with expert insights and AI powered tools for academic success

Step: 2

blur-text-image

Step: 3

blur-text-image

Ace Your Homework with AI

Get the answers you need in no time with our AI-driven, step-by-step assistance

Get Started

Recommended Textbook for

Intermediate Algebra A Text/Workbook

Authors: Charles P McKeague

2nd Edition

1483214176, 9781483214177

More Books

Students also viewed these Mathematics questions

Question

Which has the larger radius, S or S2? Explain.

Answered: 1 week ago