help please 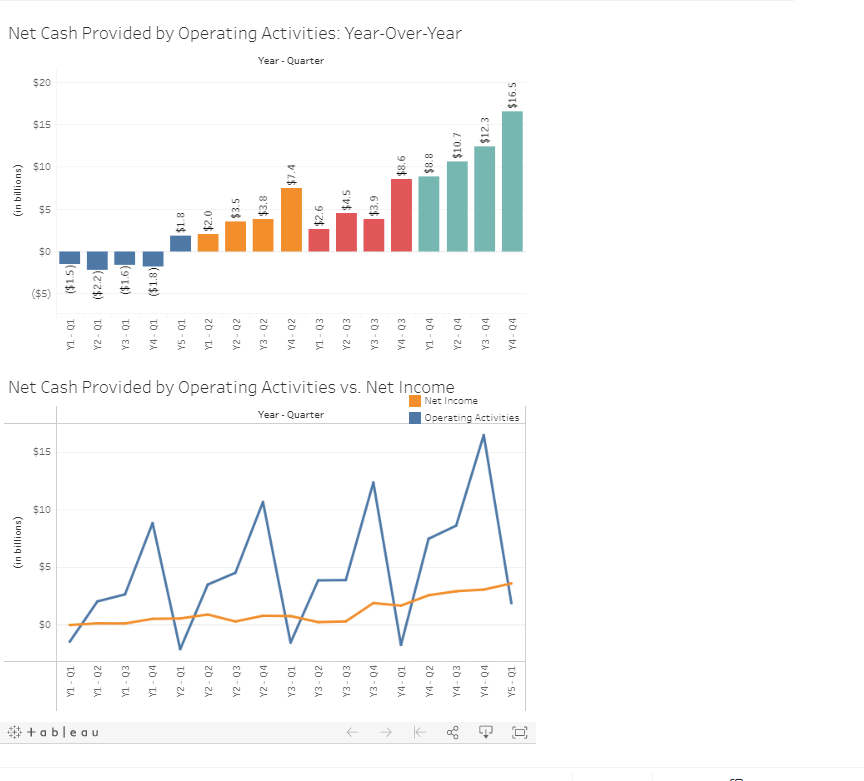
(in billions) ***** (in billions) SO 55 $10 ($5) $15 SO S5 $10 $15 $20 * tableau Y1-01 Y1-01 ($1.5 Y1-02 Y2-01 (2.2) Y3-01 (1.6) Y4-01 ($1.8) 12-01 $1.8 Y2-02 $2.0 Y2 - 03 $3.5 Y2-04 Net Cash Provided by Operating Activities vs. Net Income Year - Quarter Operating Activities Net Cash Provided by Operating Activities: Year-Over-Year Year - Quarter WA Y3-02 $3.8 Y3 - 01 Y4-02 $26 $4.5 Y3-03 $3.9 Y4-03 $8.6 K $8.8 Net Income Y2-04 $10.7 C Y4-04 $12.3 Y5 - 01 Y4-04 $16.5 0 mation 1a. Which of the following statements are true with respect to Visualization 1: Net Cash Provided by Operating Activities: Year-Over- Year? U The first five blue bars shown on the left side the chart depict net cash provided by (used in) operating activities for quarters 1-4 of year 1 and quarter 1 of year 2. The first five blue bars shown on the left side of the chart depict net cash provided by (used in) operating activities for the first quarter of years 1-5 The four orange bars show net cash provided by (used in) operating activities for the third quarter of years 1-4. 1b. Which of the following statements are true with respect to Visualization 2: Net Cash Provided by Operating Activities vs. Net Income? It provides a trend analysis of quarterly net cash provided by operating activities and net income beginning with the first quarter of year 1 and running consecutively through the first quarter of year 5. It depicts quarterly net cash provided by operating activities and net income on year-over-year basis beginning with quarter 1 of years 1-5 and ending with quarter 4 of years 1-4. It provides a trend analysis of the quarterly net change in the cash balance and the quarterly net income beginning with the first quarter of year 1 and running consecutively through the first quarter of year 5. 10. Which of the following statements are true with respect to Visualization 1: Net Cash Provided by Operating Activities: Year-Over- Year? The company's net cash provided by operating activities is always much greater in the fourth quarter of every year than in the other three quarters The net cash provided by operating activities within quarters 2. 3. and 4 has been steadily decreasing over the four-year period. The company's net cash provided by operating activities is always much lower in the first quarter of every year than in the other three quarters 1d. Which of the following statements are true with respect to Visualization 2: Net Cash Provided by Operating Activities vs. Net Income? It suggests that the company receives huge cash inflows from customers during the fourth quarter of each year, but defers paying suppliers until the first quarter of the ensuing year. The quarterly trend line for net income is much smoother than the trend line for net cash provided by operating activities. Prav HH Next > Required information It provides a trend analysis of quarterly net cash provided by operating activities and net income beginning with the first quarter of year 1 and running consecutively through the first quarter of year 5. It depicts quarterly net cash provided by operating activities and net income on year-over-year basis beginning with quarter 1 of years 1-5 and ending with quarter 4 of years 1-4. It provides a trend analysis of the quarterly net change in the cash balance and the quarterly net income beginning with the first quarter of year 1 and running consecutively through the first quarter of year 5. 1c. Which of the following statements are true with respect to Visualization 1: Net Cash Provided by Operating Activities: Year-Over- Year? The company's net cash provided by operating activities is always much greater in the fourth quarter of every year than in the other three quarters. The net cash provided by operating activities within quarters 2. 3. and 4 has been steadily decreasing over the four-year period. The company's net cash provided by operating activities is always much lower in the first quarter of every year than in the other three quarters. 1d. Which of the following statements are true with respect to Visualization 2: Net Cash Provided by Operating Activities vs. Net Income? It suggests that the company receives huge cash inflows from customers during the fourth quarter of each year, but defers paying suppliers until the first quarter of the ensuing year. The quarterly trend line for net income is much smoother than the trend line for net cash provided by operating activities The net income is very erratic with peaks in each fourth quarter followed by valleys in each first quarter. 1e. Which of the following statements are true when comparing Visualizations 1 and 2? Visualization 1 focuses solely on cash flows whereas Visualization 2 compares net cash provided by operating activities to net income. Visualization 1 compares net cash provided by operating activities to net income whereas Visualization 2 focuses solely on cash flows. Both visualizations focus on trends in net income