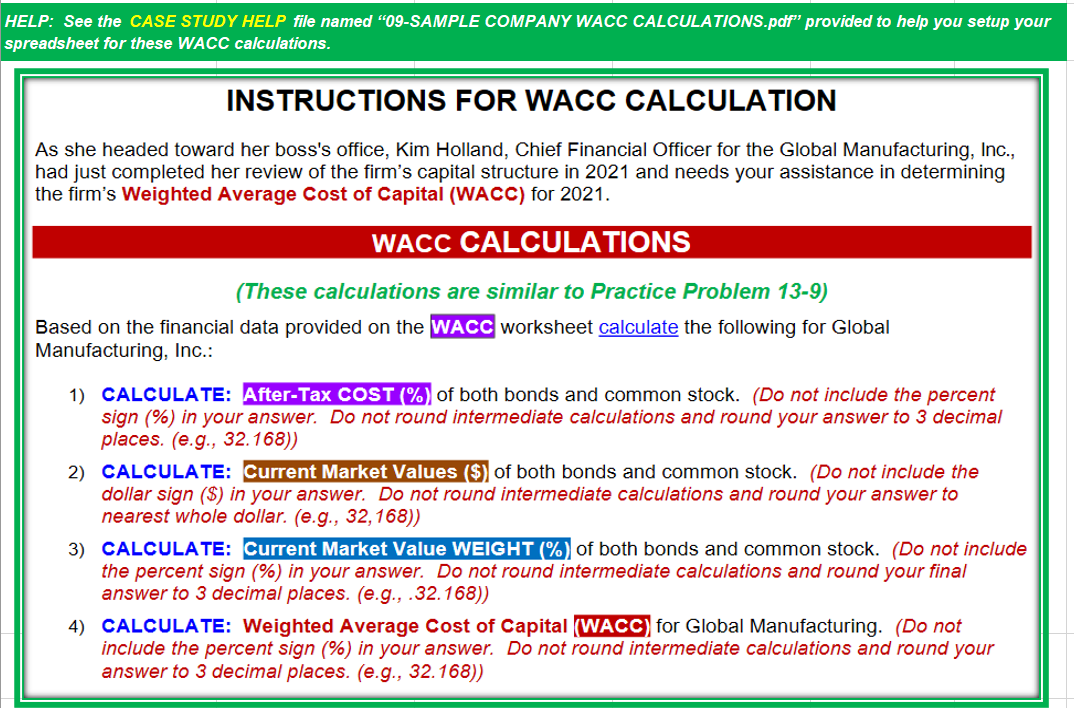
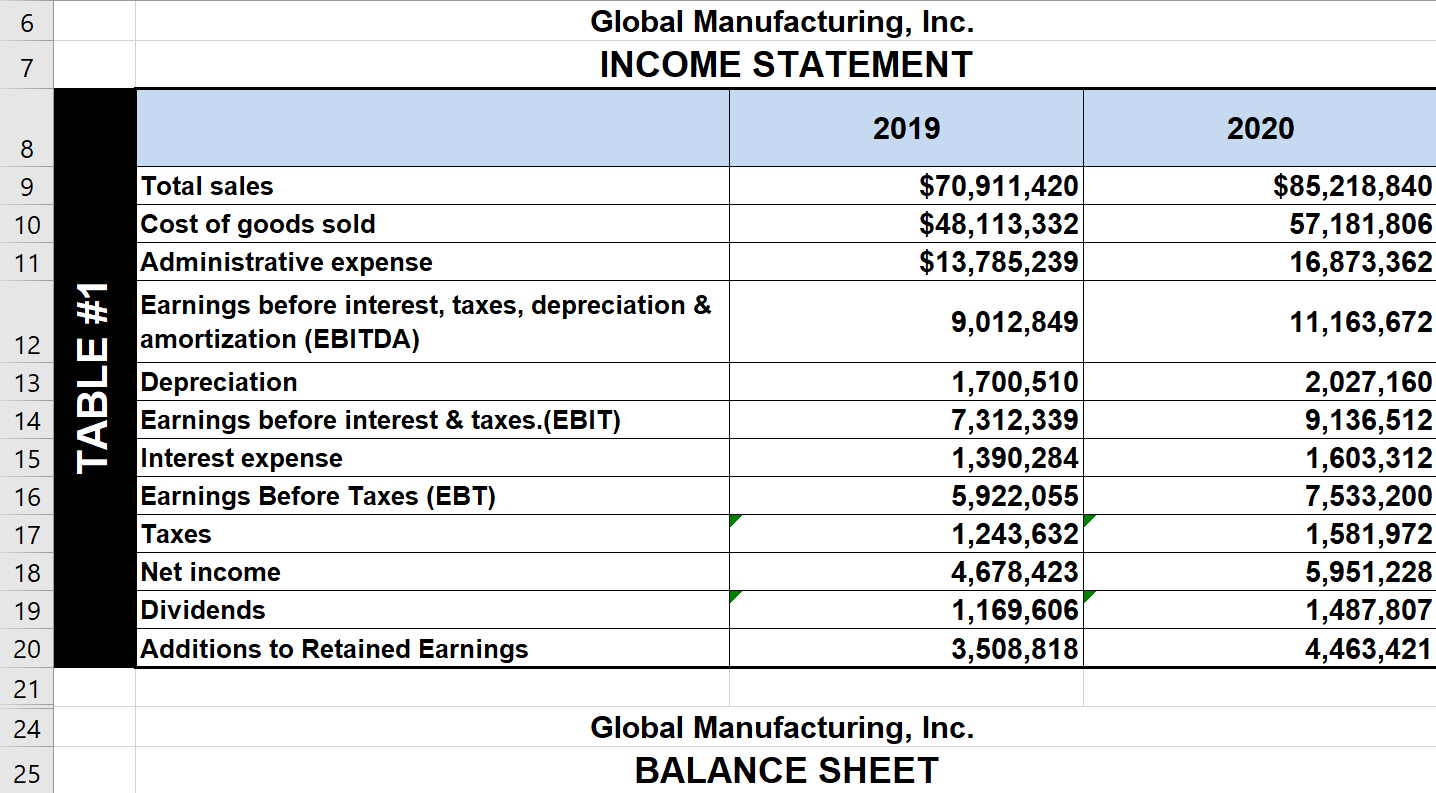
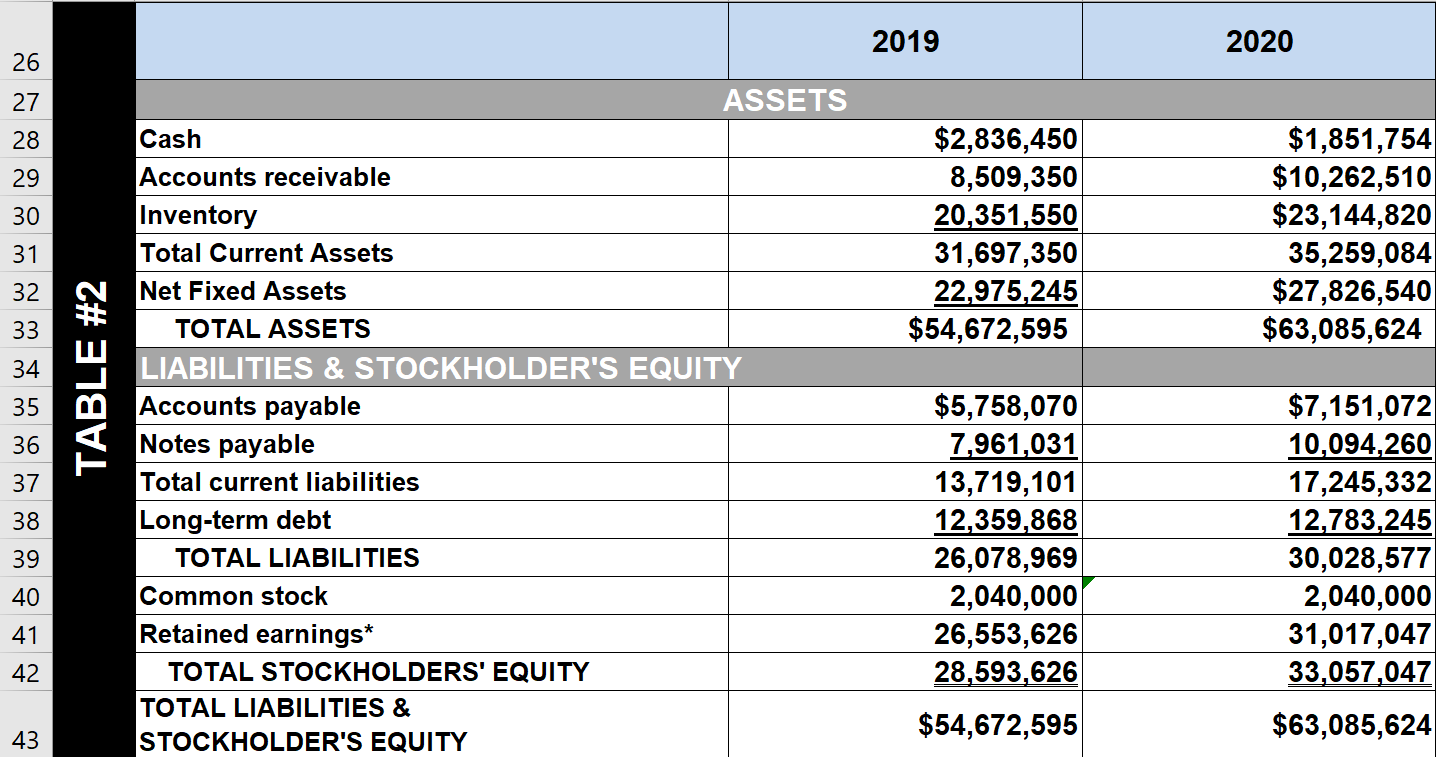
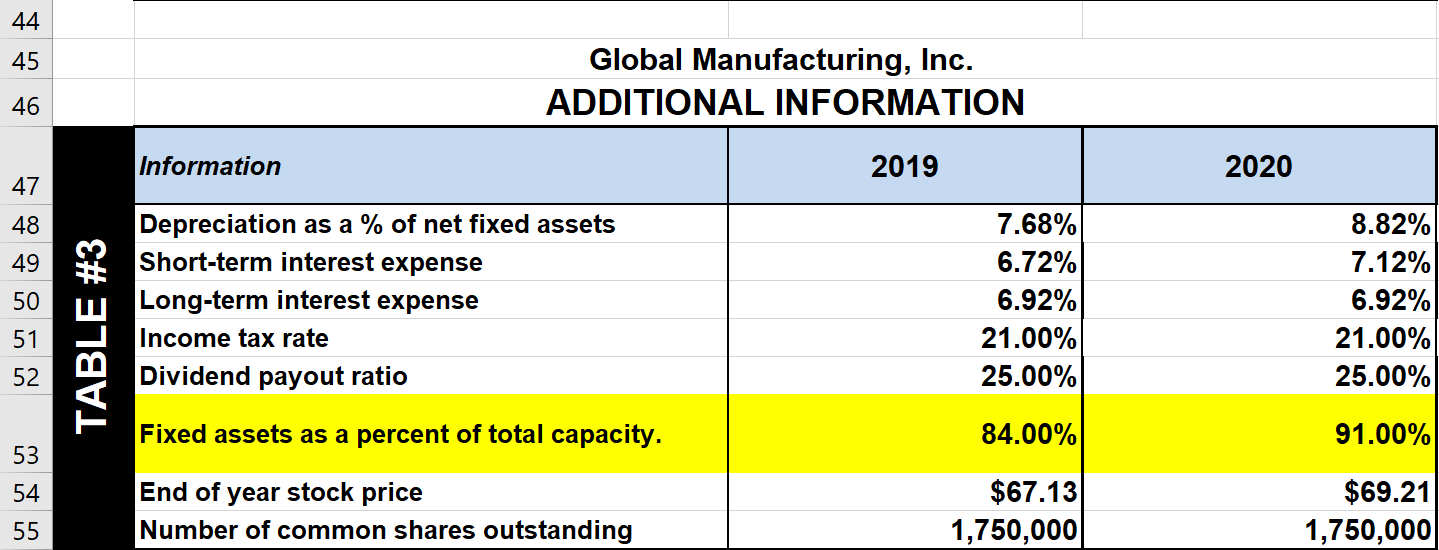
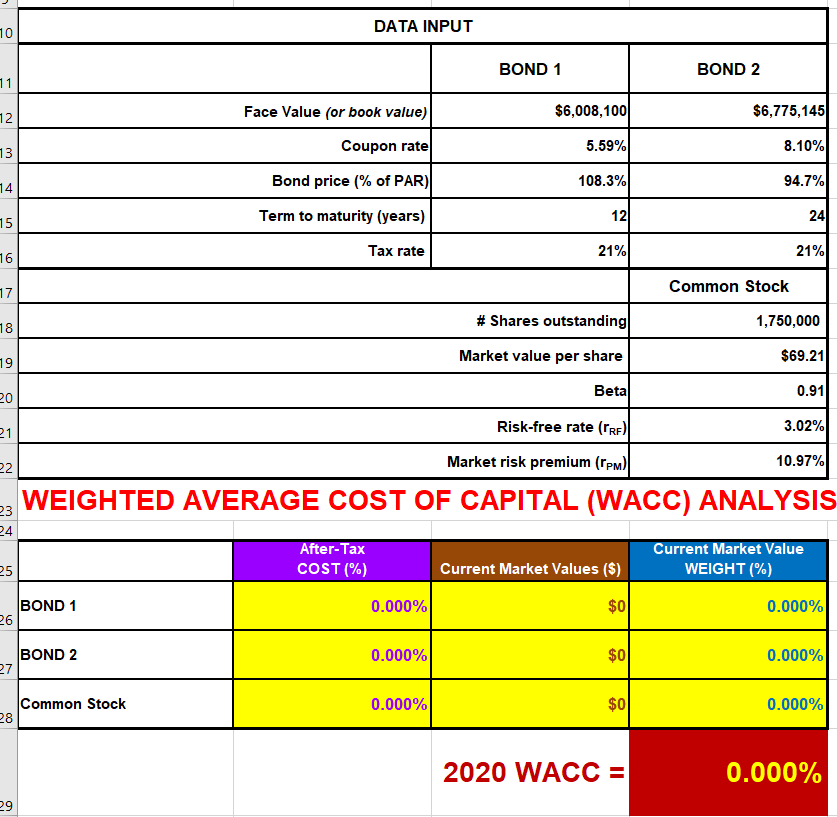
HELP: See the CASE STUDY HELP file named "09-SAMPLE COMPANY WACC CALCULATIONS.pdf" provided to help you setup your spreadsheet for these WACC calculations. INSTRUCTIONS FOR WACC CALCULATION As she headed toward her boss's office, Kim Holland, Chief Financial Officer for the Global Manufacturing, Inc., had just completed her review of the firm's capital structure in 2021 and needs your assistance in determining the firm's Weighted Average Cost of Capital (WACC) for 2021. WACC CALCULATIONS (These calculations are similar to Practice Problem 13-9) Based on the financial data provided on the WACC worksheet calculate the following for Global Manufacturing, Inc.: 1) CALCULATE: After-Tax COST (%) of both bonds and common stock. (Do not include the percent sign (%) in your answer. Do not round intermediate calculations and round your answer to 3 decimal places. (e.g., 32.168)) 2) CALCULATE: Current Market Values ($) of both bonds and common stock. (Do not include the dollar sign ($) in your answer. Do not round intermediate calculations and round your answer to nearest whole dollar. (e.g., 32,168)) 3) CALCULATE: Current Market Value WEIGHT (%) of both bonds and common stock. (Do not include the percent sign (%) in your answer. Do not round intermediate calculations and round your final answer to 3 decimal places. (e.g., .32.168)) 4) CALCULATE: Weighted Average cost of Capital (WACC) for Global Manufacturing. (Do not include the percent sign (%) in your answer. Do not round intermediate calculations and round your answer to 3 decimal places. (e.g., 32.168)) 6 Global Manufacturing, Inc. INCOME STATEMENT 7 2019 2020 89 0 1 $70,911,420 $48,113,332 $13,785,239 $85,218,840 57,181,806 16,873,362 9,012,849 11,163,672 12 13 TABLE #1 14 Total sales Cost of goods sold Administrative expense Earnings before interest, taxes, depreciation & amortization (EBITDA) Depreciation Earnings before interest & taxes.(EBIT) Interest expense Earnings Before Taxes (EBT) Taxes Net income Dividends Additions to Retained Earnings 15 16 1,700,510 7,312,339 1,390,284 5,922,055 1,243,632 4,678,423 1,169,606 3,508,818 2,027,160 9,136,512 1,603,312 7,533,200 1,581,972 5,951,228 1,487,807 4,463,421 17 18 19 20 21 24 Global Manufacturing, Inc. BALANCE SHEET 25 2019 2020 26 27 28 29 30 $2,836,450 8,509,350 20,351,550 31,697,350 22,975,245 $54,672,595 $1,851,754 $10,262,510 $23,144,820 35,259,084 $27,826,540 $63,085,624 31 32 33 34 TABLE #2 35 ASSETS Cash Accounts receivable Inventory Total Current Assets Net Fixed Assets TOTAL ASSETS LIABILITIES & STOCKHOLDER'S EQUITY Accounts payable Notes payable Total current liabilities Long-term debt TOTAL LIABILITIES Common stock Retained earnings* TOTAL STOCKHOLDERS' EQUITY TOTAL LIABILITIES & STOCKHOLDER'S EQUITY 36 37 38 $5,758,070 7,961,031 13,719,101 12,359,868 26,078,969 2,040,000 26,553,626 28,593,626 $7,151,072 10,094,260 17,245,332 12,783,245 30,028,577 2,040,000 31,017,047 33,057,047 39 40 41 42 $54,672,595 $63,085,624 43 44 45 Global Manufacturing, Inc. ADDITIONAL INFORMATION 46 Information 2019 2020 47 48 49 50 Depreciation as a % of net fixed assets Short-term interest expense Long-term interest expense Income tax rate Dividend payout ratio TABLE #3 7.68% 6.72% 6.92% 21.00% 25.00% 8.82% 7.12% 6.92% 21.00% 25.00% 51 52 Fixed assets as a percent of total capacity. 84.00% 91.00% 53 54 End of year stock price Number of common shares outstanding $67.13 1,750,000 $69.21 1,750,000 55 10 DATA INPUT BOND 1 BOND 2 11 12 Face Value (or book value) $6,008,100 $6,775,145 Coupon rate 5.59% 8.10% 3 4 Bond price (% of PAR) 108.3% 94.7% 15 121 Term to maturity (years) 241 16 Tax rate 21% 21% 17 Common Stock 18 1,750,000 # Shares outstanding 19 Market value per share $69.21 Betal 0.91 20 21 3.02% Risk-free rate (TRE) 22 Market risk premium (TPM) 10.97% WEIGHTED AVERAGE COST OF CAPITAL (WACC) ANALYSIS 23 24 After-Tax COST(%) Current Market Value WEIGHT (%) 25 Current Market Values ($) BOND 1 26 0.000% $0 0.000% BOND 2 27 0.000% $0 0.000% Common Stock 0.000% $0 0.000% 28 2020 WACC = 0.000% 29