

Answered step by step
Verified Expert Solution
Question
1 Approved Answer
help with 57-59 More about Histograms and Gaussian Distributions so. For the following vabile characteristics, discuss the shape of the histogram and the distribution function
help with 57-59 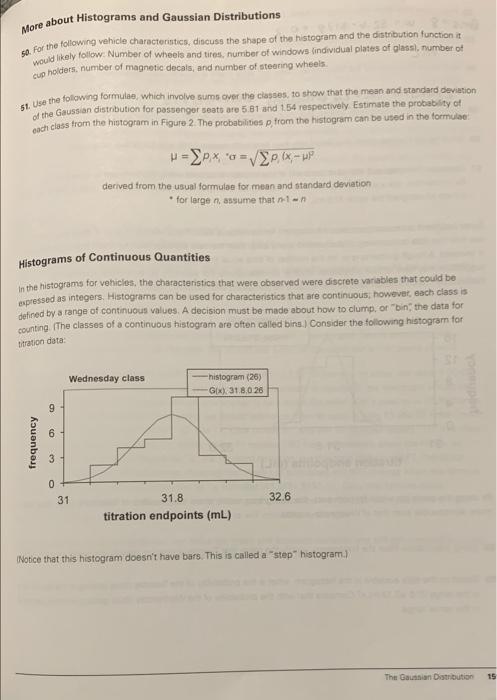
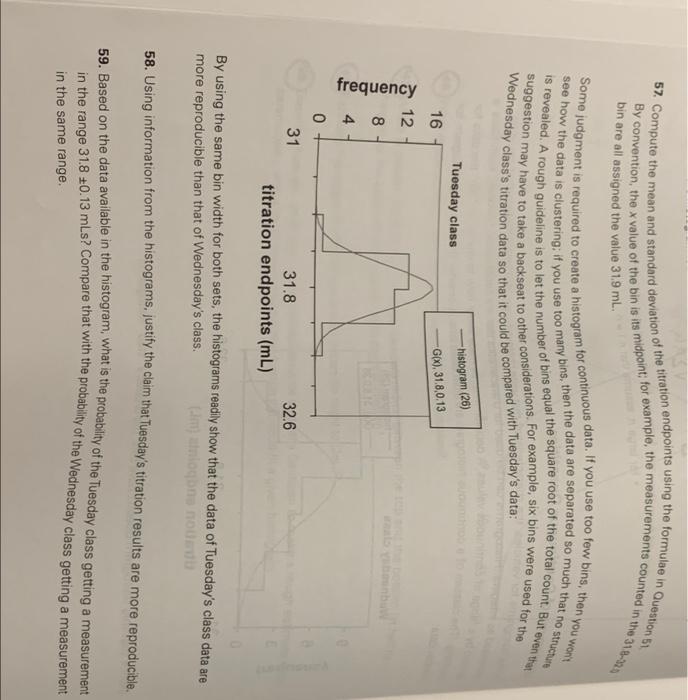
More about Histograms and Gaussian Distributions so. For the following vabile characteristics, discuss the shape of the histogram and the distribution function it would likely follow: Number of wheels and tires, number of windows lindividual plates of glass, number of cup holders, number of magnetic decals, and number of steering wheels 51. Use the following formulae, which involve sums over the classes, 10 show that the mean and standard deviation of the Gaussian distribution for passenger seats are 581 and 154 respectively Estimate the probability of each class from the histogram in Figure 2. The probabilities p, from the histogram can be used in the formule - (, - derived from the usual formula for mean and standard deviation * for large n. assume that non Histograms of Continuous Quantities in the histograms for vehicles, the characteristics that were observed were discrete variables that could be expressed as integers. Histograms can be used for characteristics that are continuous; however, each class is defined by a range of continuous values. A decision must be made about how to clump, or "bin the data for counting (The classes of a continuous histogram are often called bins.) Consider the following histogram for bration data Wednesday class histogram (26) Gix) 31.8.0.26 9 frequency 3 0 31 32.6 31.8 titration endpoints (ml) Notice that this histogram doesn't have bars. This is called a "step" histogram) The Ganan Distribution 15 57. Compute the mean and standard deviation of the titration endpoints using the formulae in Question 51 By convention, the x value of the bin is its midpoint; for example, the measurements counted in the 31-32) bin are all assigned the value 31.9 mL. Some judgment is required to create a histogram for continuous data. If you use too few bins, then you won't is revealed. A rough guideline is to let the number of bins equal the square root of the total count. But even the see how the data is clustering, if you use too many bins, then the data are separated so much that no strutture suggestion may have to take a backseat to other considerations. For example, six bins were used for the Wednesday class's titration data so that it could be compared with Tuesday's data: Tuesday class -histogram (26) -G(X), 31.8,0.13 16 12 frequency 4 0 31 32.6 31.8 titration endpoints (mL) By using the same bin width for both sets, the histograms readily show that the data of Tuesday's class data are more reproducible than that of Wednesday's class. logone non 58. Using information from the histograms, justify the claim that Tuesday's titration results are more reproducible. 59. Based on the data available in the histogram, what is the probability of the Tuesday class getting a measurement in the range 31.8 +0.13 mLs? Compare that with the probability of the Wednesday class getting a measurement in the same range Step by Step Solution
There are 3 Steps involved in it
Step: 1

Get Instant Access to Expert-Tailored Solutions
See step-by-step solutions with expert insights and AI powered tools for academic success
Step: 2

Step: 3
Ace Your Homework with AI
Get the answers you need in no time with our AI-driven, step-by-step assistance
Get Started
Bioprocess Engineering Basic Concepts
Authors: Michael Shuler, Fikret Kargi, Matthew DeLisa
3rd Edition
0137062702, 978-0137062706