Answered step by step
Verified Expert Solution
Question
1 Approved Answer
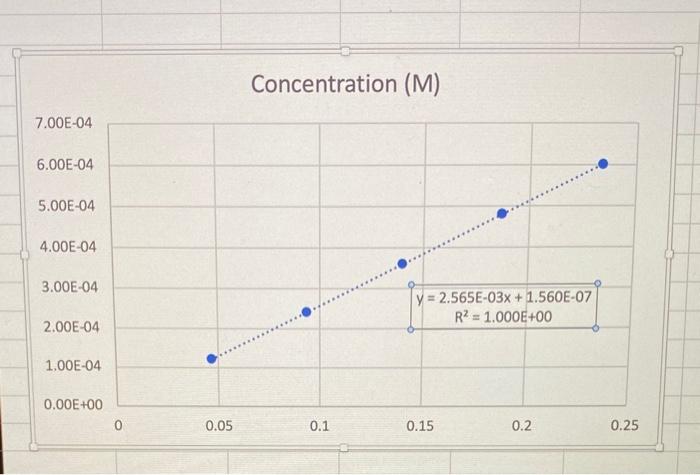
help with both 2 and 3 please!! Here is the graph i got! 2. A linear standard curve of KMnO4 is prepared from a set
help with both 2 and 3 please!! 

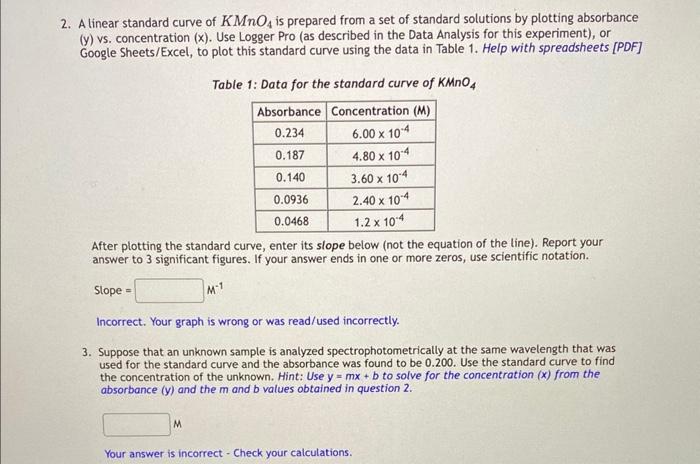
2. A linear standard curve of KMnO4 is prepared from a set of standard solutions by plotting absorbance (y) vs. concentration ( x ). Use Logger Pro (as described in the Data Analysis for this experiment), or Google Sheets/Excel, to plot this standard curve using the data in Table 1. Help with spreadsheets [PDF] Table 1: Data for the standard curve of KMnO4 After plotting the standard curve, enter its slope below (not the equation of the line). Report your answer to 3 significant figures. If your answer ends in one or more zeros, use scientific notation. Slope =M1 Incorrect. Your graph is wrong or was read/used incorrectly. 3. Suppose that an unknown sample is analyzed spectrophotometrically at the same wavelength that was used for the standard curve and the absorbance was found to be 0.200. Use the standard curve to find the concentration of the unknown. Hint: Use y=mx+b to solve for the concentration (x) from the absorbance (y) and the m and b values obtained in question 2 . Concentration (M) 
Here is the graph i got!

Step by Step Solution
There are 3 Steps involved in it
Step: 1

Get Instant Access to Expert-Tailored Solutions
See step-by-step solutions with expert insights and AI powered tools for academic success
Step: 2

Step: 3

Ace Your Homework with AI
Get the answers you need in no time with our AI-driven, step-by-step assistance
Get Started


