Help with these please. 16
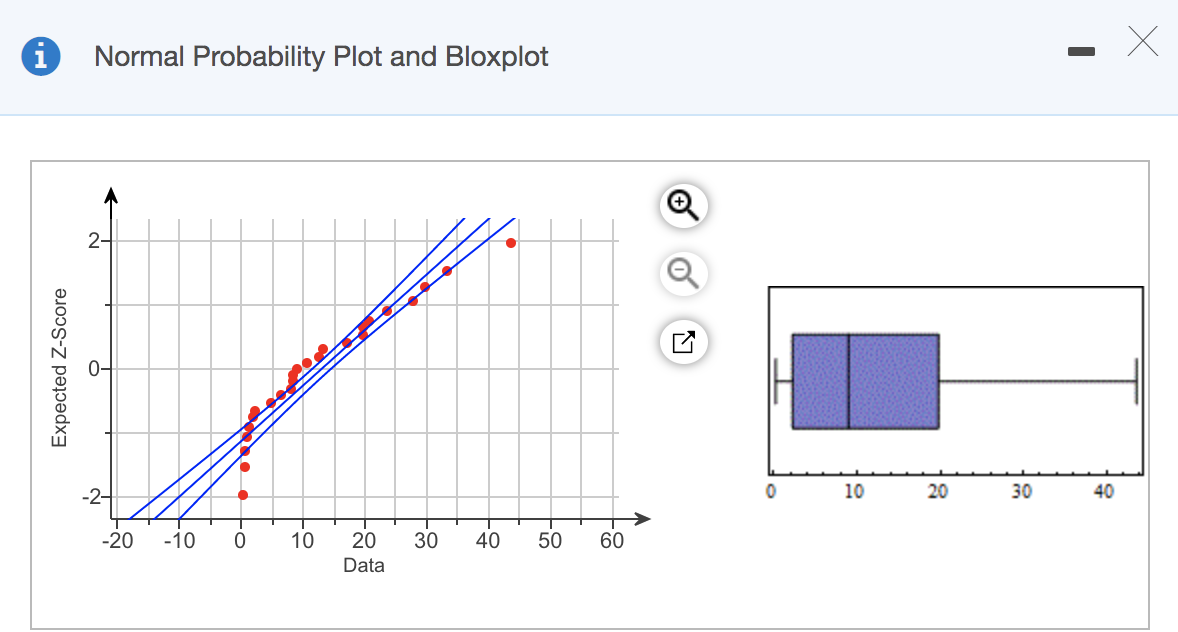
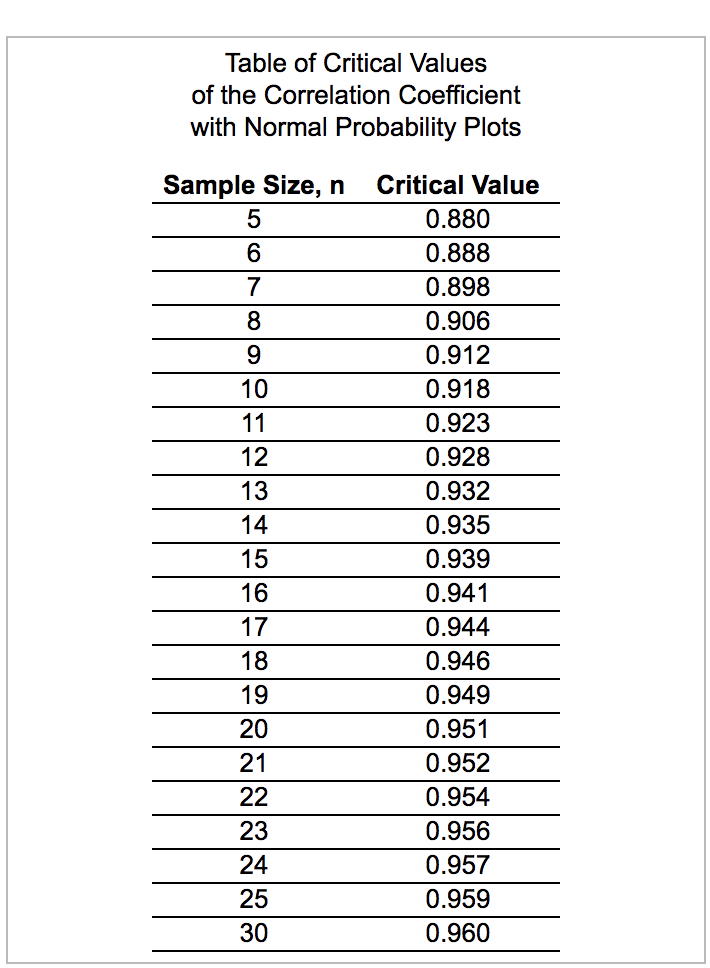
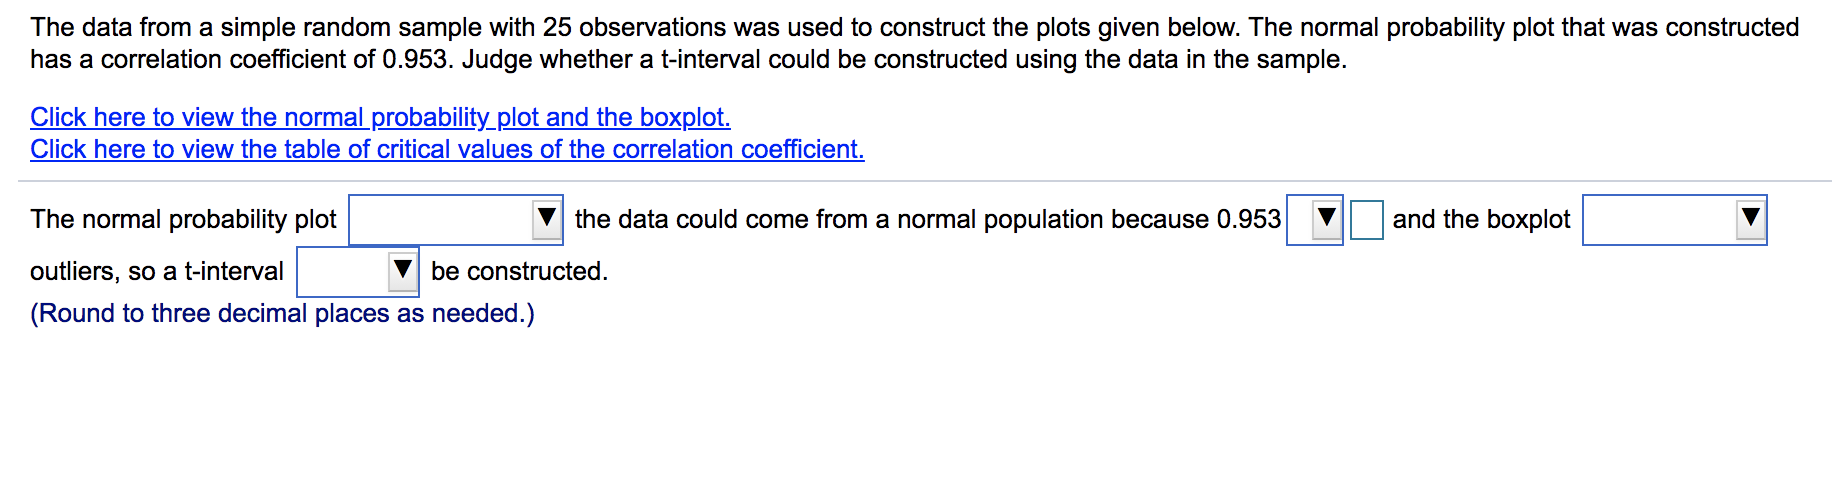
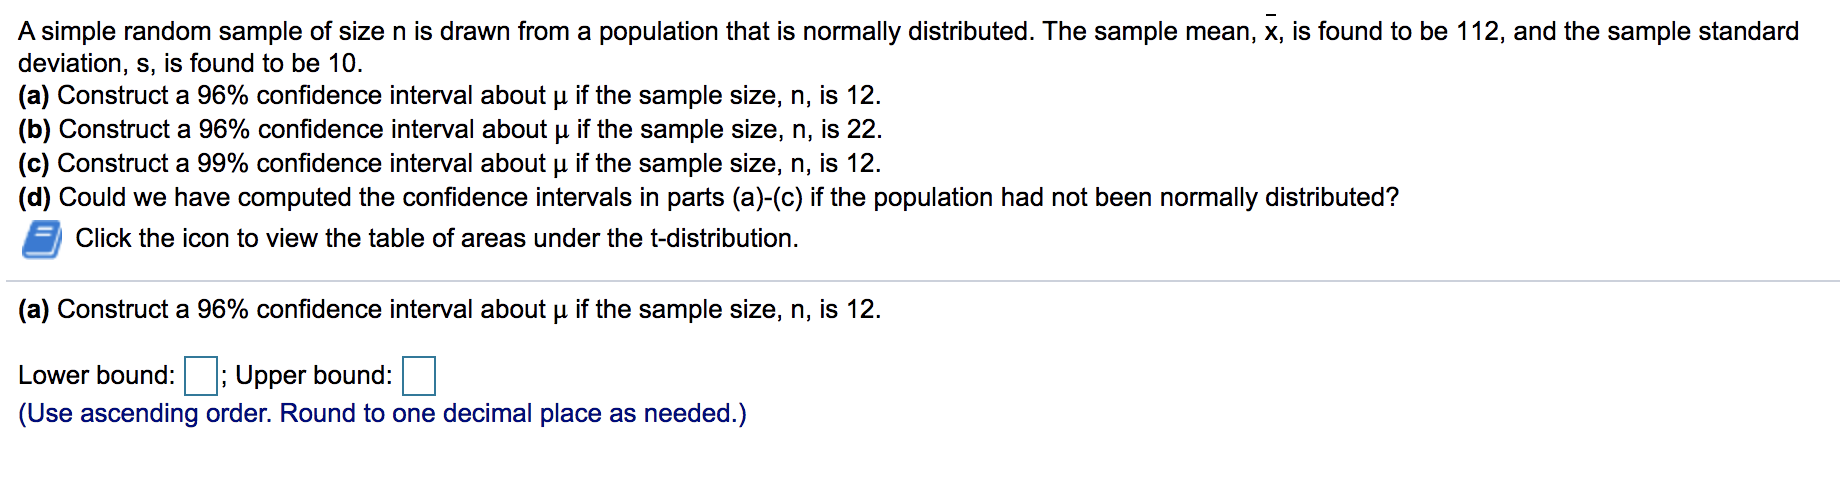
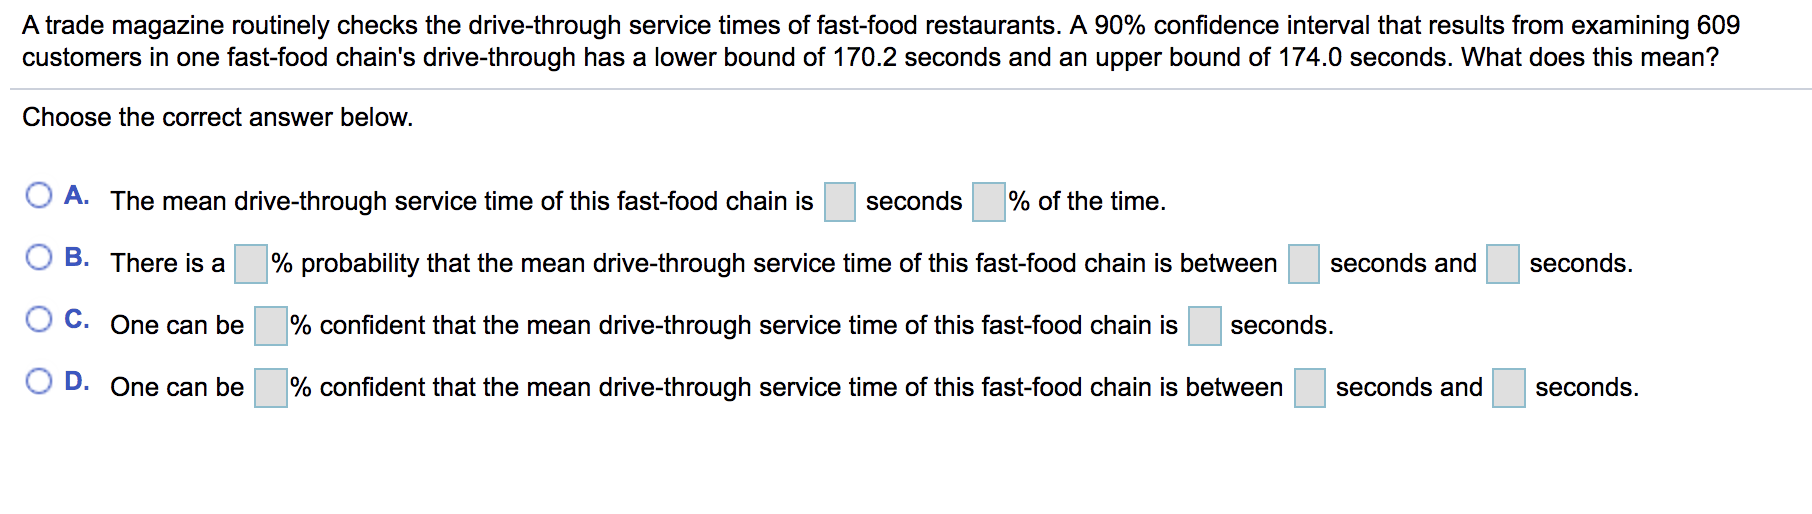
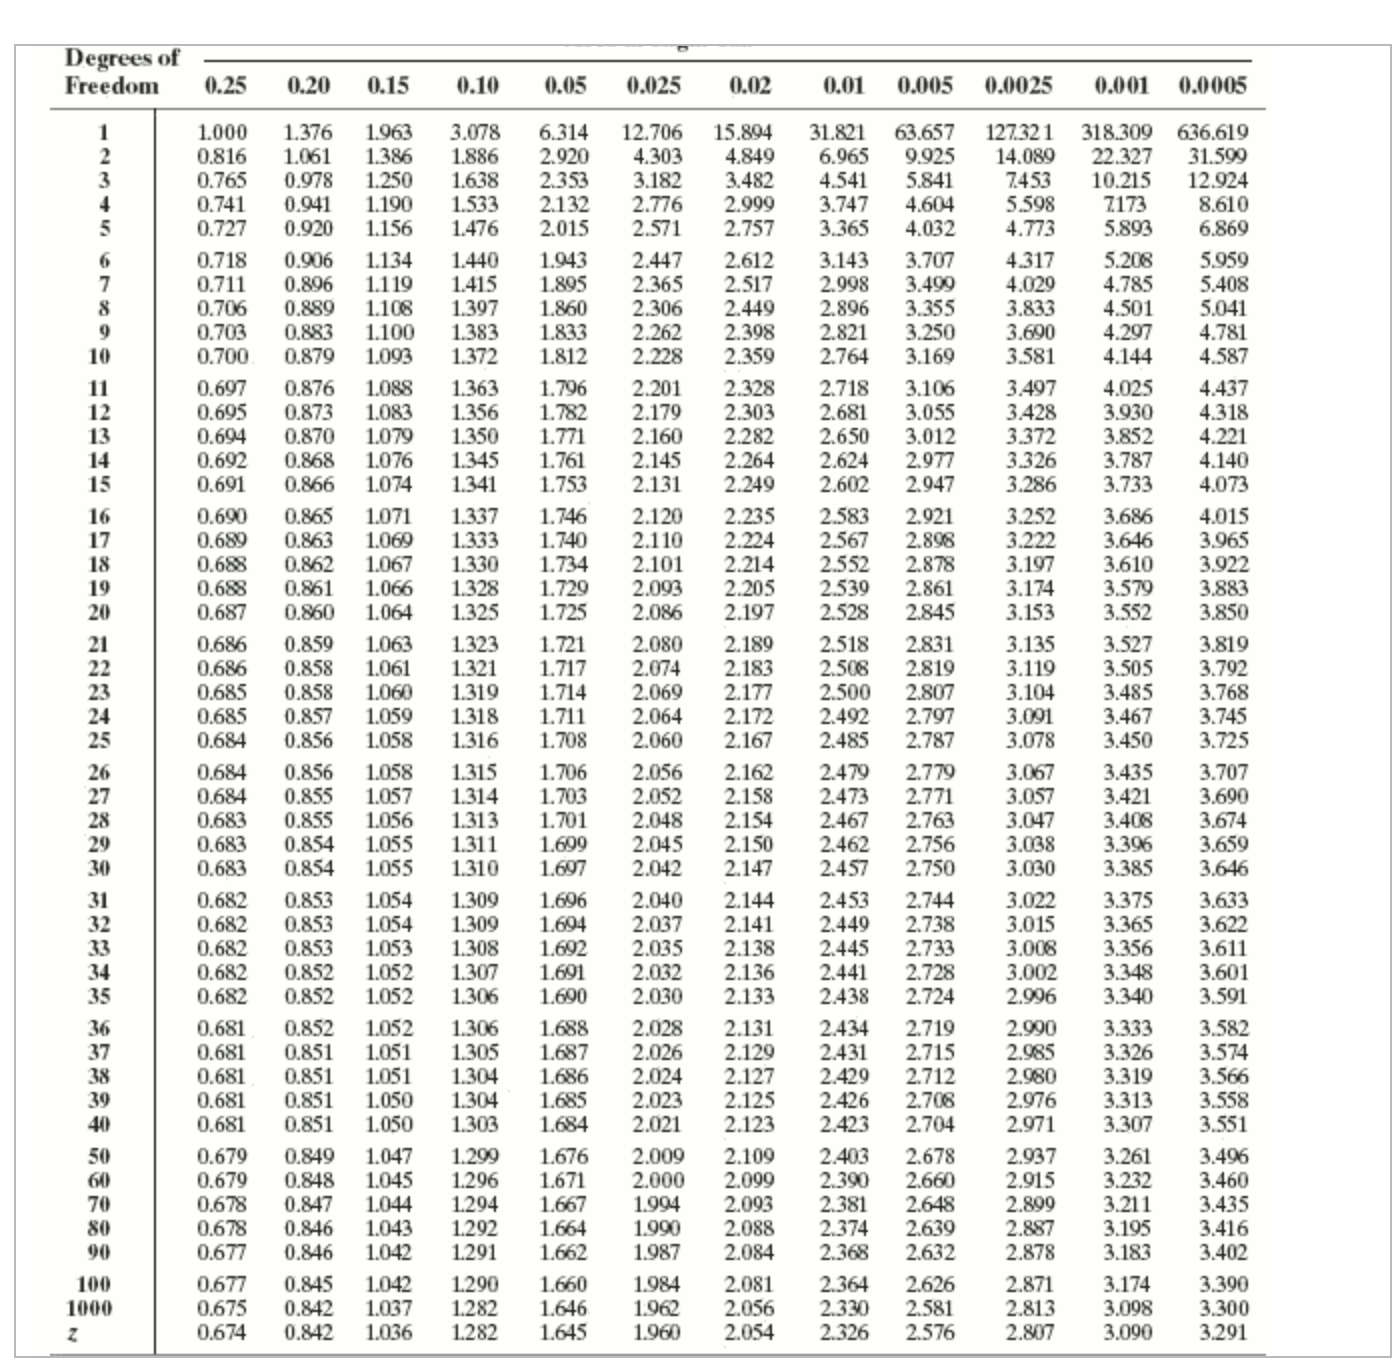
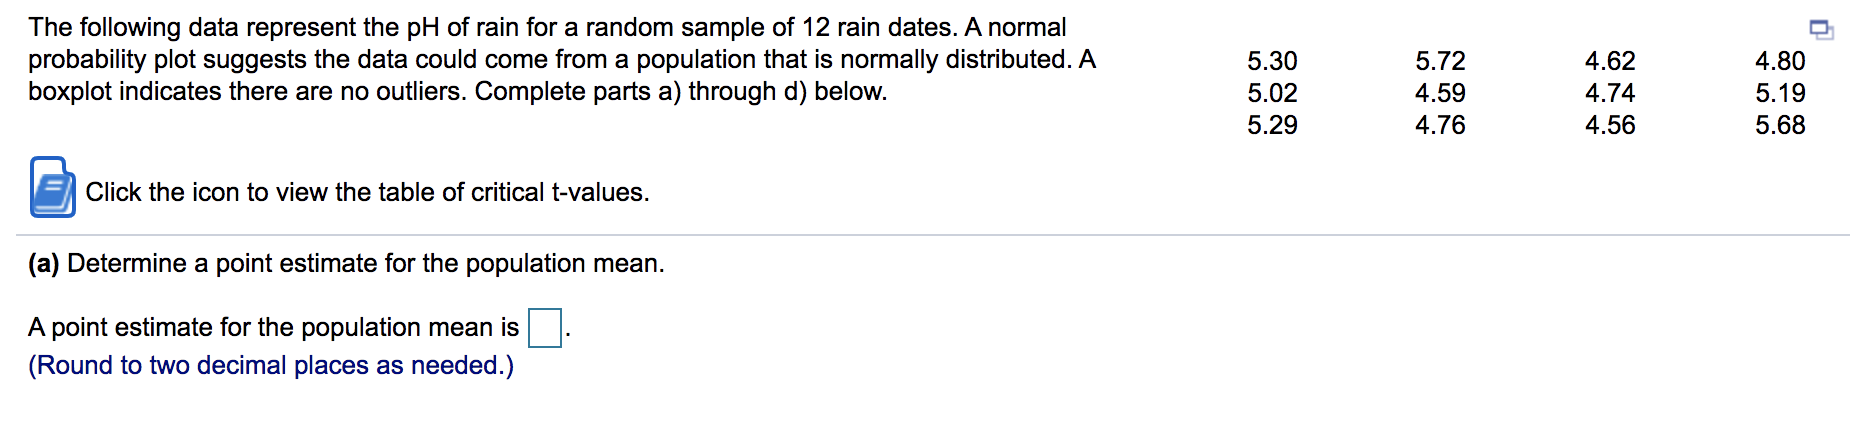
\fTable of Critical Values of the Correlation Coefficient with Normal Probability Plots Sample Size, n Critical Value 5 0.880 6 0.888 7 0.898 8 0.906 9 0.912 10 0.918 11 0.923 12 0.928 13 0.932 14 0.935 15 0.939 16 0.941 17 0.944 18 0.946 19 0.949 20 0.951 21 0.952 22 0.954 23 0.956 24 0.957 25 0.959 30 0.960The data from a simple random sample with 25 observations was used to construct the plots given below. The normal probability plot that was constructed has a correlation coefficient of 0.953. Judge whether a t-interval could be constructed using the data in the sample. Click here to view the normal probability plot and the boxplot. Click here to view the table of critical values of the correlation coefficient. The normal probability plot the data could come from a normal population because 0.953 and the boxplot outliers, so a t-interval be constructed. (Round to three decimal places as needed.)A simple random sample of size n is drawn from a population that is normally distributed. The sample mean, x, is found to be 112, and the sample standard deviation, s, is found to be 10. (a) Construct a 96% confidence interval about u if the sample size, n, is 12. (b) Construct a 96% confidence interval about u if the sample size, n, is 22. (c) Construct a 99% confidence interval about u if the sample size, n, is 12. (d) Could we have computed the confidence intervals in parts (a)-(c) if the population had not been normally distributed? Click the icon to view the table of areas under the t-distribution. (a) Construct a 96% confidence interval about u if the sample size, n, is 12. Lower bound: ; Upper bound: (Use ascending order. Round to one decimal place as needed.)A trade magazine routinely checks the drive-through service times of fast-food restaurants. A 90% confidence interval that results from examining 609 customers in one fast-food chain's drive-through has a lower bound of 170.2 seconds and an upper bound of 174.0 seconds. What does this mean? Choose the correct answer below. O A. The mean drive-through service time of this fast-food chain is seconds % of the time. O B. There is a % probability that the mean drive-through service time of this fast-food chain is between seconds and seconds. O C. One can be % confident that the mean drive-through service time of this fast-food chain is seconds. O D. One can be % confident that the mean drive-through service time of this fast-food chain is between seconds and seconds.\fThe following data represent the pH of rain for a random sample of 12 rain dates. A normal probability plot suggests the data could come from a population that is normally distributed. A 5.30 5,72 4.62 4.80 boxplot indicates there are no outliers. Complete parts a) through d) below. 5.02 4.59 4.74 5.19 5.29 4.76 4.56 5.68 Click the icon to view the table of critical t-values. (a) Determine a point estimate for the population mean. A point estimate for the population mean is :|. (Round to two decimal places as needed.)