

Answered step by step
Verified Expert Solution
Question
1 Approved Answer
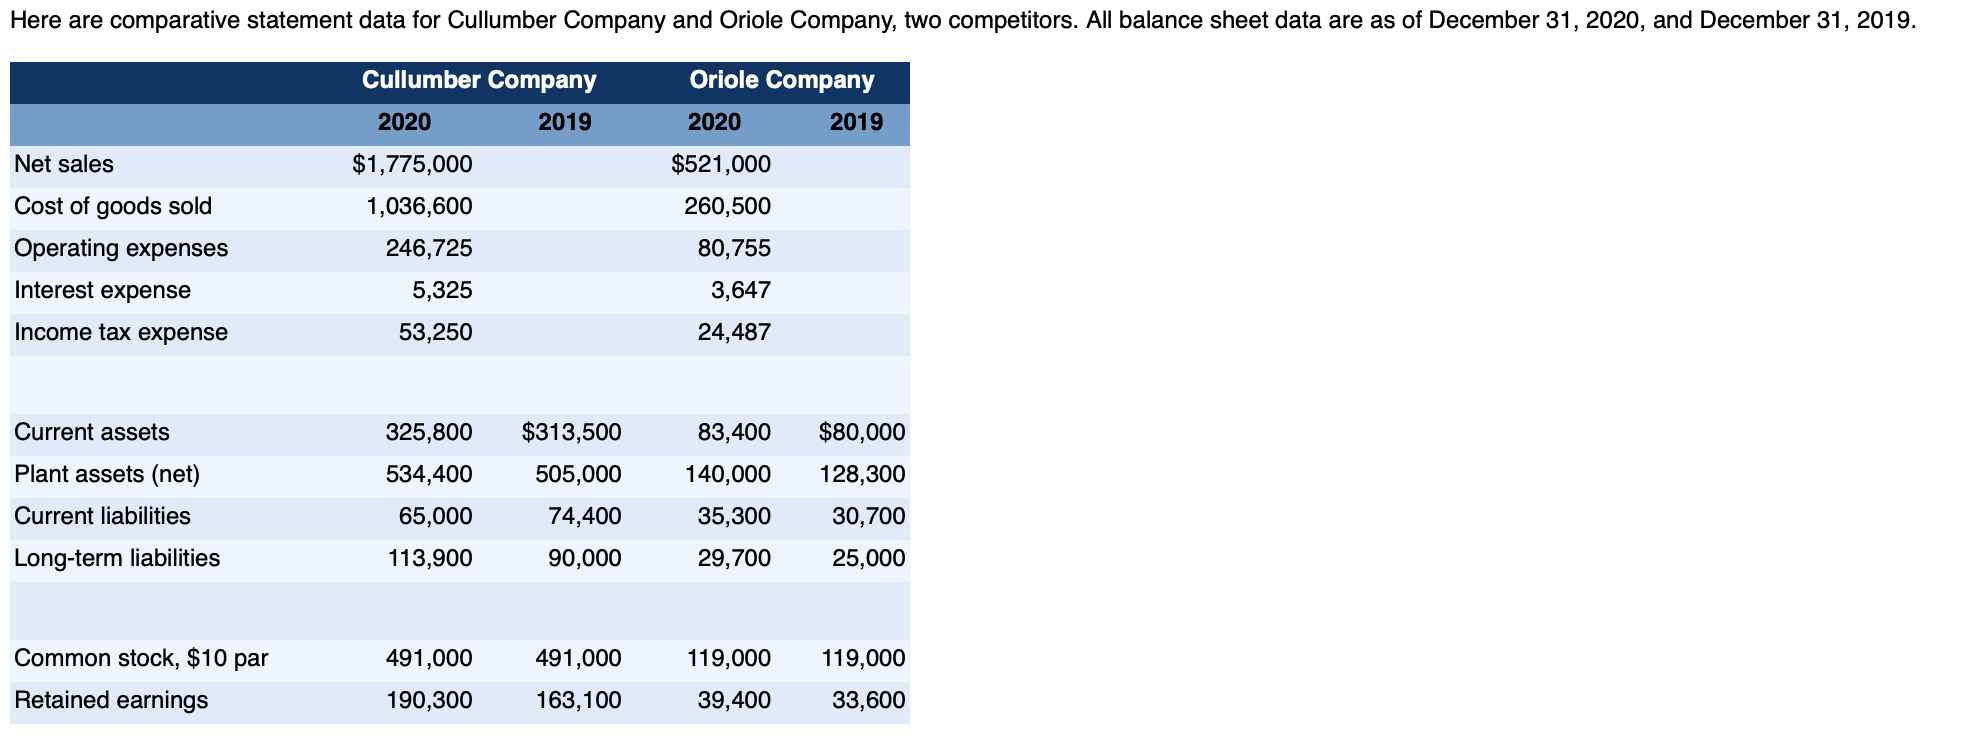
Here are comparative statement data for Cullumber Company and Oriole Company, two competitors. All balance sheet data are as of December 31, 2020, and December
Step by Step Solution
There are 3 Steps involved in it
Step: 1

Get Instant Access to Expert-Tailored Solutions
See step-by-step solutions with expert insights and AI powered tools for academic success
Step: 2

Step: 3
Ace Your Homework with AI
Get the answers you need in no time with our AI-driven, step-by-step assistance
Get Started
Conducting Church Audits A Guide For Internal Auditors
Authors: Jeremy W Odom
1st Edition
0997095628, 978-0997095623