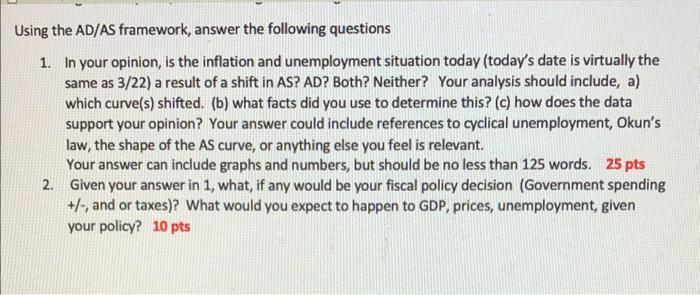
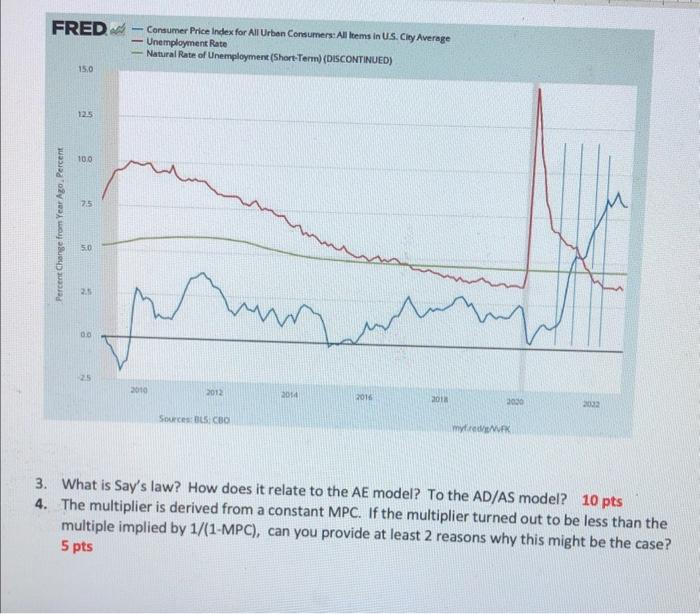
Here is a graph (this pertains to just the first 2 questions) for several economic series: the consumer price index, CPI,(blue line), the unemployment rate, U/E (red line), natural rate of unemployment NRU (green line). The 4 vertical lines represent dates (more importantly, events). Here are the dates and the values of each series at that date: 1st line 1/21CPI1.35%,U/E6.4%, NRU 4.5% 2nd line 7/21 CPI 5.2\% U/E 5.2% NRU 4.5% 3rd line 11/21 CPI 6.8%, U/E 4.5%, NRU 4.5% 4th line 3/22 CPI 8.55% U/E 3.6%, NRU 4.5% Let's review why each date is important. 1/21: starting point, halcyon days for inflation. This can be considered the base line. Note the level of cyclical unemployment and where this might be represented in the AD/AS framework. Also, this is the middle of the pandemic, so supply chain issues could be an influence. 7/21 CPI no longer benign. Again, note where this might be in an AD/AS framework. 11/21 CPI spurts, note level of cyclical unemployment 3/22 Data continues, Putin invades Ukraine. Energy costs skyrocket. (note. Data as of this writing are much the same). During the course of these dates, the US economy was emerging from a recession induced by the Covid 19 virus. Importantly, this was the shortest recession on record, 3 months. There was a variety of stimulus packages passed by both the Trump and Biden administrations, the total amount is subject to some disagreement, but $5 trillion is a good working number. Usine the AD/AS framework. answer the following questions Jsing the AD/AS framework, answer the following questions 1. In your opinion, is the inflation and unemployment situation today (today's date is virtually the same as 3/22) a result of a shift in AS? AD? Both? Neither? Your analysis should include, a) which curve(s) shifted. (b) what facts did you use to determine this? (c) how does the data support your opinion? Your answer could include references to cyclical unemployment, Okun's law, the shape of the AS curve, or anything else you feel is relevant. Your answer can include graphs and numbers, but should be no less than 125 words. 25 pts 2. Given your answer in 1, what, if any would be your fiscal policy decision (Government spending +/, and or taxes)? What would you expect to happen to GDP, prices, unemployment, given your policy? 10pts 3. What is Say's law? How does it relate to the AE model? To the AD/AS model? 10pts 4. The multiplier is derived from a constant MPC. If the multiplier turned out to be less than the multiple implied by 1/(1MPC), can you provide at least 2 reasons why this might be the case? 5 pts