Answered step by step
Verified Expert Solution
Question
1 Approved Answer
Here is a table to analyze: Frequency of adjustments Total Up Down 10.7% 17.1% 96.5% 97.1% 10.5% 15.4% 94.9% 88.8% 0.2% 1.7% 1.7% 8.3% Net
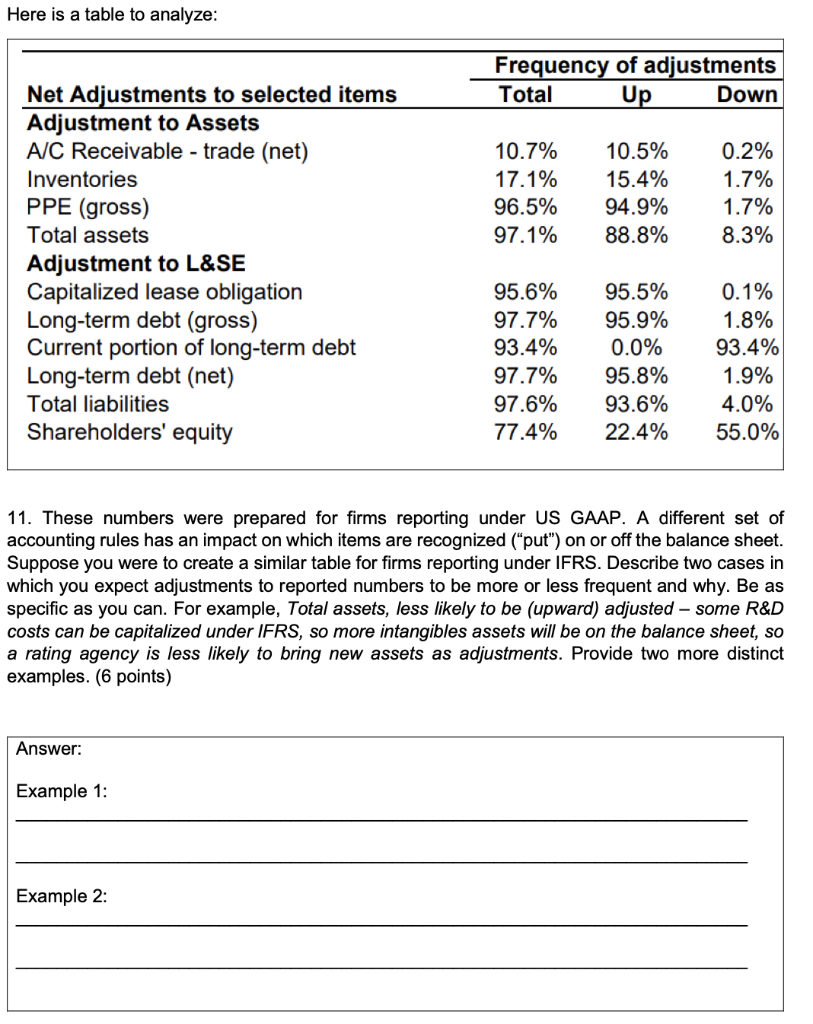
Here is a table to analyze: Frequency of adjustments Total Up Down 10.7% 17.1% 96.5% 97.1% 10.5% 15.4% 94.9% 88.8% 0.2% 1.7% 1.7% 8.3% Net Adjustments to selected items Adjustment to Assets A/C Receivable - trade (net) Inventories PPE (gross) Total assets Adjustment to L&SE Capitalized lease obligation Long-term debt (gross) Current portion of long-term debt Long-term debt (net) Total liabilities Shareholders' equity 95.6% 97.7% 93.4% 97.7% 97.6% 77.4% 95.5% 95.9% 0.0% 95.8% 93.6% 22.4% 0.1% 1.8% 93.4% 1.9% 4.0% 55.0% 11. These numbers were prepared for firms reporting under US GAAP. A different set of accounting rules has an impact on which items are recognized (put") on or off the balance sheet. Suppose you were to create a similar table for firms reporting under IFRS. Describe two cases in which you expect adjustments to reported numbers to be more or less frequent and why. Be as specific as you can. For example, Total assets, less likely to be (upward) adjusted - some R&D costs can be capitalized under IFRS, so more intangibles assets will be on the balance sheet, so a rating agency is less likely to bring new assets as adjustments. Provide two more distinct examples. (6 points) Answer: Example 1: Example 2
Step by Step Solution
There are 3 Steps involved in it
Step: 1
Get Instant Access to Expert-Tailored Solutions
See step-by-step solutions with expert insights and AI powered tools for academic success
Step: 2
Step: 3
Ace Your Homework with AI
Get the answers you need in no time with our AI-driven, step-by-step assistance
Get Started