

Answered step by step
Verified Expert Solution
Question
1 Approved Answer
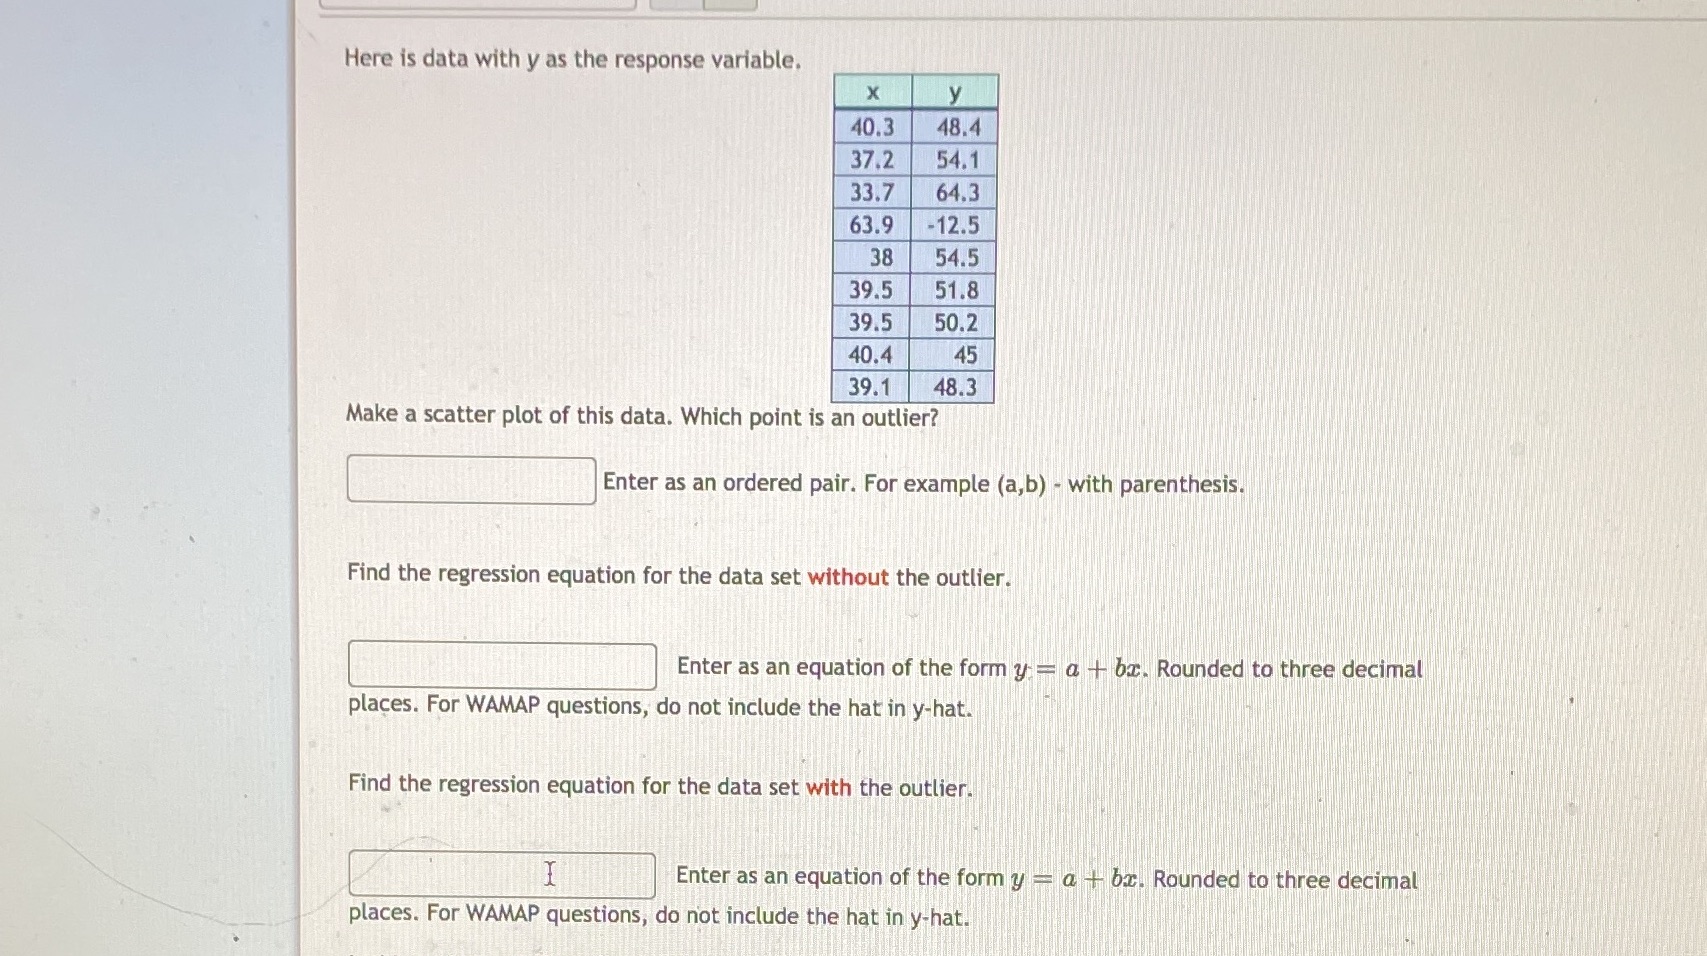
Here is data with y as the response variable. X y 40.3 48.4 37.2 54.1 33.7 64.3 63.9 -12.5 38 54.5 39.5 51.8 39.5 50.2
Step by Step Solution
There are 3 Steps involved in it
Step: 1

Get Instant Access to Expert-Tailored Solutions
See step-by-step solutions with expert insights and AI powered tools for academic success
Step: 2

Step: 3
Ace Your Homework with AI
Get the answers you need in no time with our AI-driven, step-by-step assistance
Get Started
Finite Mathematics
Authors: Stefan Waner, Jerry Lee Ford Jr, Waner/Costenoble, Steven Costenoble
5th Edition
1111789304, 9781111789305