Answered step by step
Verified Expert Solution
Question
1 Approved Answer
Herman Miller's cost of goods sold has increased from $1.343 billion to $1.637 billion over the last five years, a 21.9% increase. Should investors be

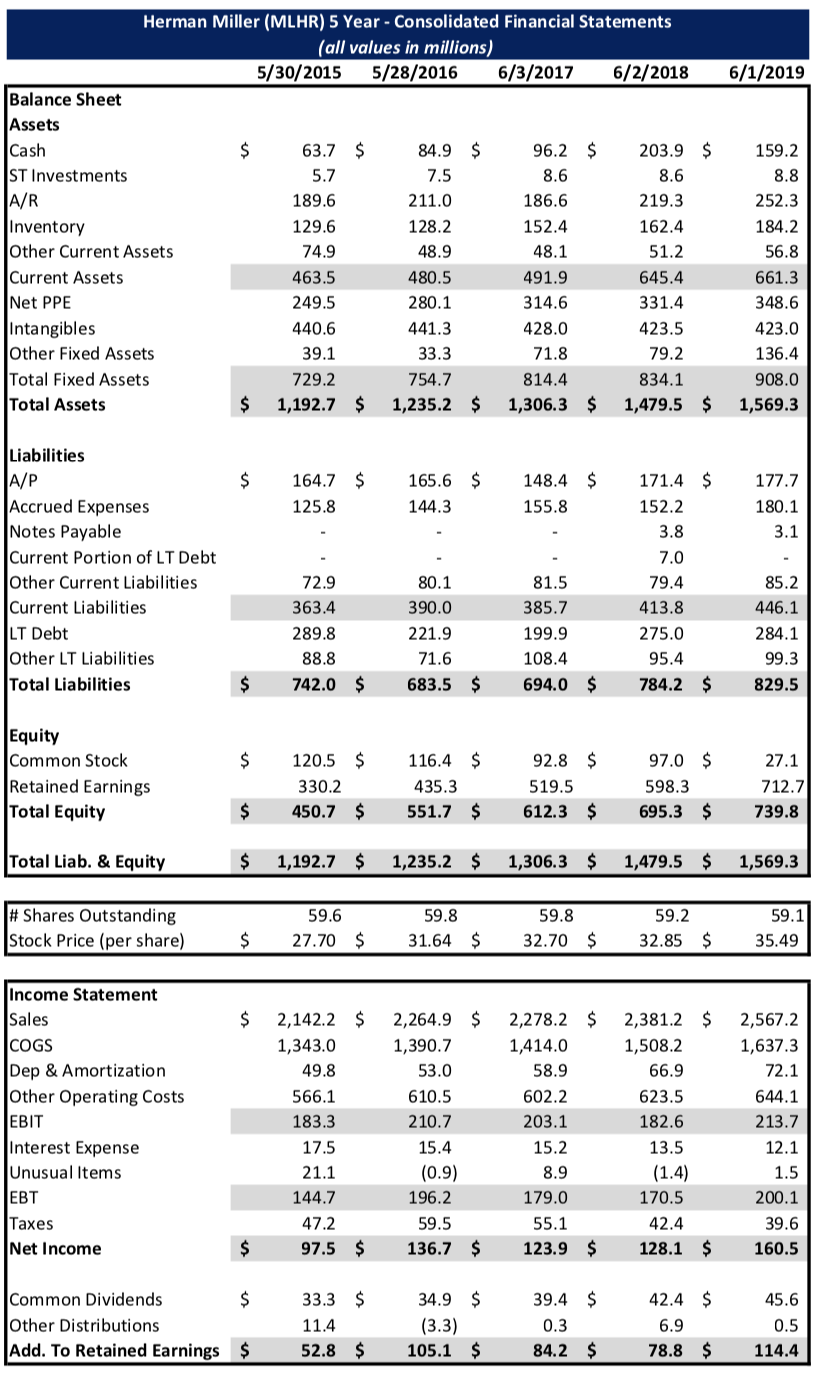
Herman Miller's cost of goods sold has increased from $1.343 billion to $1.637 billion over the last five years, a 21.9% increase. Should investors be concerned that Herman Miller is having difficulty containing one of the largest components of its operating costs? Explain why or why not
6/1/2019 $ Herman Miller (MLHR) 5 Year - Consolidated Financial Statements (all values in millions) 5/30/2015 5/28/2016 6/3/2017 6/2/2018 Balance Sheet Assets Cash 63.7 $ 84.9 $ 96.2 $ 203.9 ST Investments 5.7 7.5 8.6 8.6 A/R 189.6 211.0 186.6 219.3 Inventory 129.6 128.2 152.4 162.4 Other Current Assets 74.9 48.9 48.1 51.2 Current Assets 463.5 480.5 491.9 645.4 Net PPE 249.5 280.1 314.6 331.4 Intangibles 440.6 441.3 428.0 423.5 Other Fixed Assets 39.1 33.3 71.8 79.2 Total Fixed Assets 729.2 754.7 814.4 834.1 Total Assets $ 1,192.7 $ 1,235.2 $ 1,306.3 $ 1,479.5 159.2 8.8 252.3 184.2 56.8 661.3 348.6 423.0 136.4 908.0 1,569.3 $ $ $ $ 164.7 $ 125.8 165.6 144.3 148.4 $ 155.8 177.7 180.1 3.1 Liabilities A/P Accrued Expenses Notes Payable Current Portion of LT Debt Other Current Liabilities Current Liabilities LT Debt Other LT Liabilities Total Liabilities 72.9 363.4 289.8 88.8 742.0 85.2 80.1 390.0 221.9 71.6 683.5 171.4 152.2 3.8 7.0 79.4 413.8 275.0 95.4 784.2 81.5 385.7 199.9 108.4 694.0 446.1 284.1 99.3 829.5 $ $ $ $ $ $ $ $ $ $ Equity Common Stock Retained Earnings Total Equity 120.5 330.2 450.7 116.4 435.3 551.7 92.8 519.5 612.3 97.0 598.3 695.3 27.1 712.7 739.8 $ $ $ $ $ Total Liab. & Equity $ 1,192.7 $ 1,235.2 $ 1,306.3 $ 1,479.5 $ 1,569.3 # Shares Outstanding Stock Price (per share) 59.6 27.70 59.8 31.64 $ 59.8 32.70 $ 59.2 32.85 59.1 35.49 | $ $ $ $ Income Statement Sales COGS Dep & Amortization Other Operating Costs EBIT Interest Expense Unusual Items EBT Taxes Net Income 2,142.2 $ 1,343.0 49.8 566.1 183.3 17.5 21.1 144.7 47.2 97.5 $ 2,264.9 $ 1,390.7 53.0 610.5 210.7 15.4 (0.9) 196.2 59.5 136.7 $ 2,278.2 $ 1,414.0 58.9 602.2 203.1 15.2 8.9 179.0 55.1 123.9 $ 2,381.2 $ 1,508.2 66.9 623.5 182.6 13.5 (1.4) 170.5 42.4 128.1 $ 2,567.2 1,637.3 72.1 644.1 213.7 12.1 1.5 200.1 39.6 160.5 $ $ $ $ Common Dividends $ Other Distributions Add. To Retained Earnings $ 33.3 11.4 52.8 34.9 $ (3.3) 105.1 $ 39.4 0.3 84.2 42.4 6.9 78.8 45.6 0.5 114.4 $ $ $Step by Step Solution
There are 3 Steps involved in it
Step: 1

Get Instant Access to Expert-Tailored Solutions
See step-by-step solutions with expert insights and AI powered tools for academic success
Step: 2

Step: 3

Ace Your Homework with AI
Get the answers you need in no time with our AI-driven, step-by-step assistance
Get Started


