

Answered step by step
Verified Expert Solution
Question
1 Approved Answer
HFCL: valuing a high growth company Alok Kastia Himachal Futuristic Communications Ltd. (HFCL) went for business restructuring and corporate debt restructuring in FY[1] 2009-2010 owing
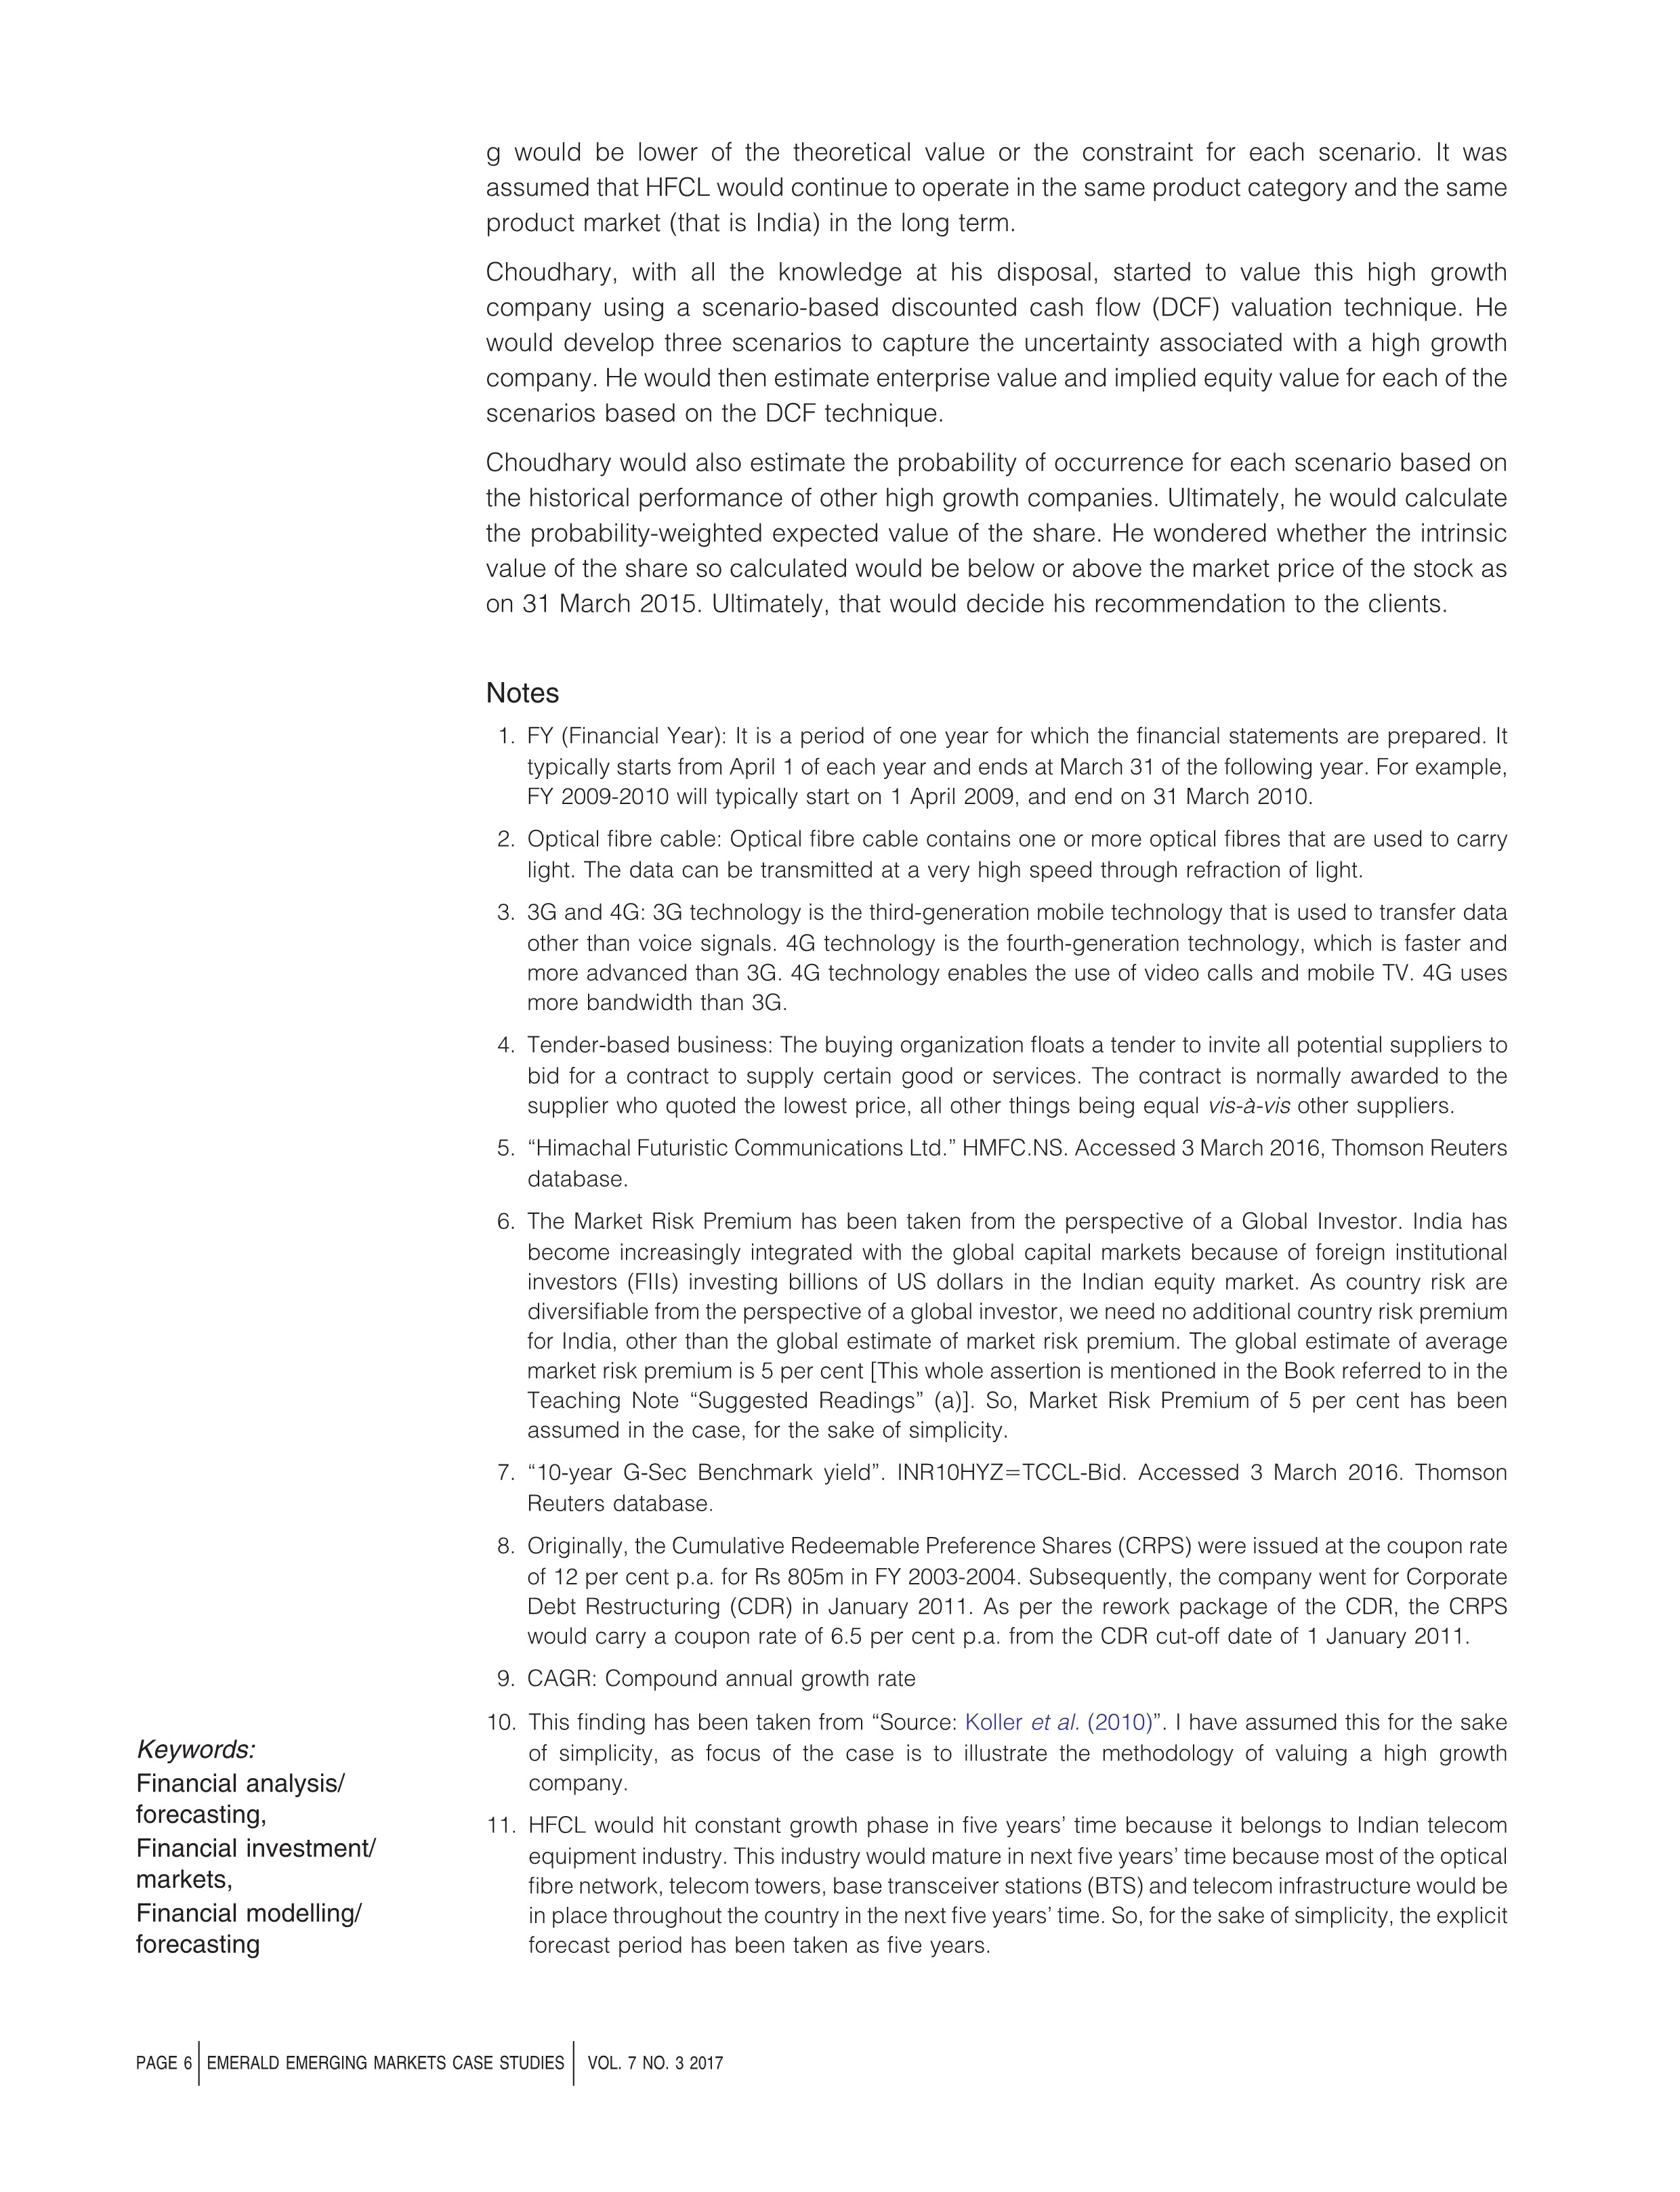
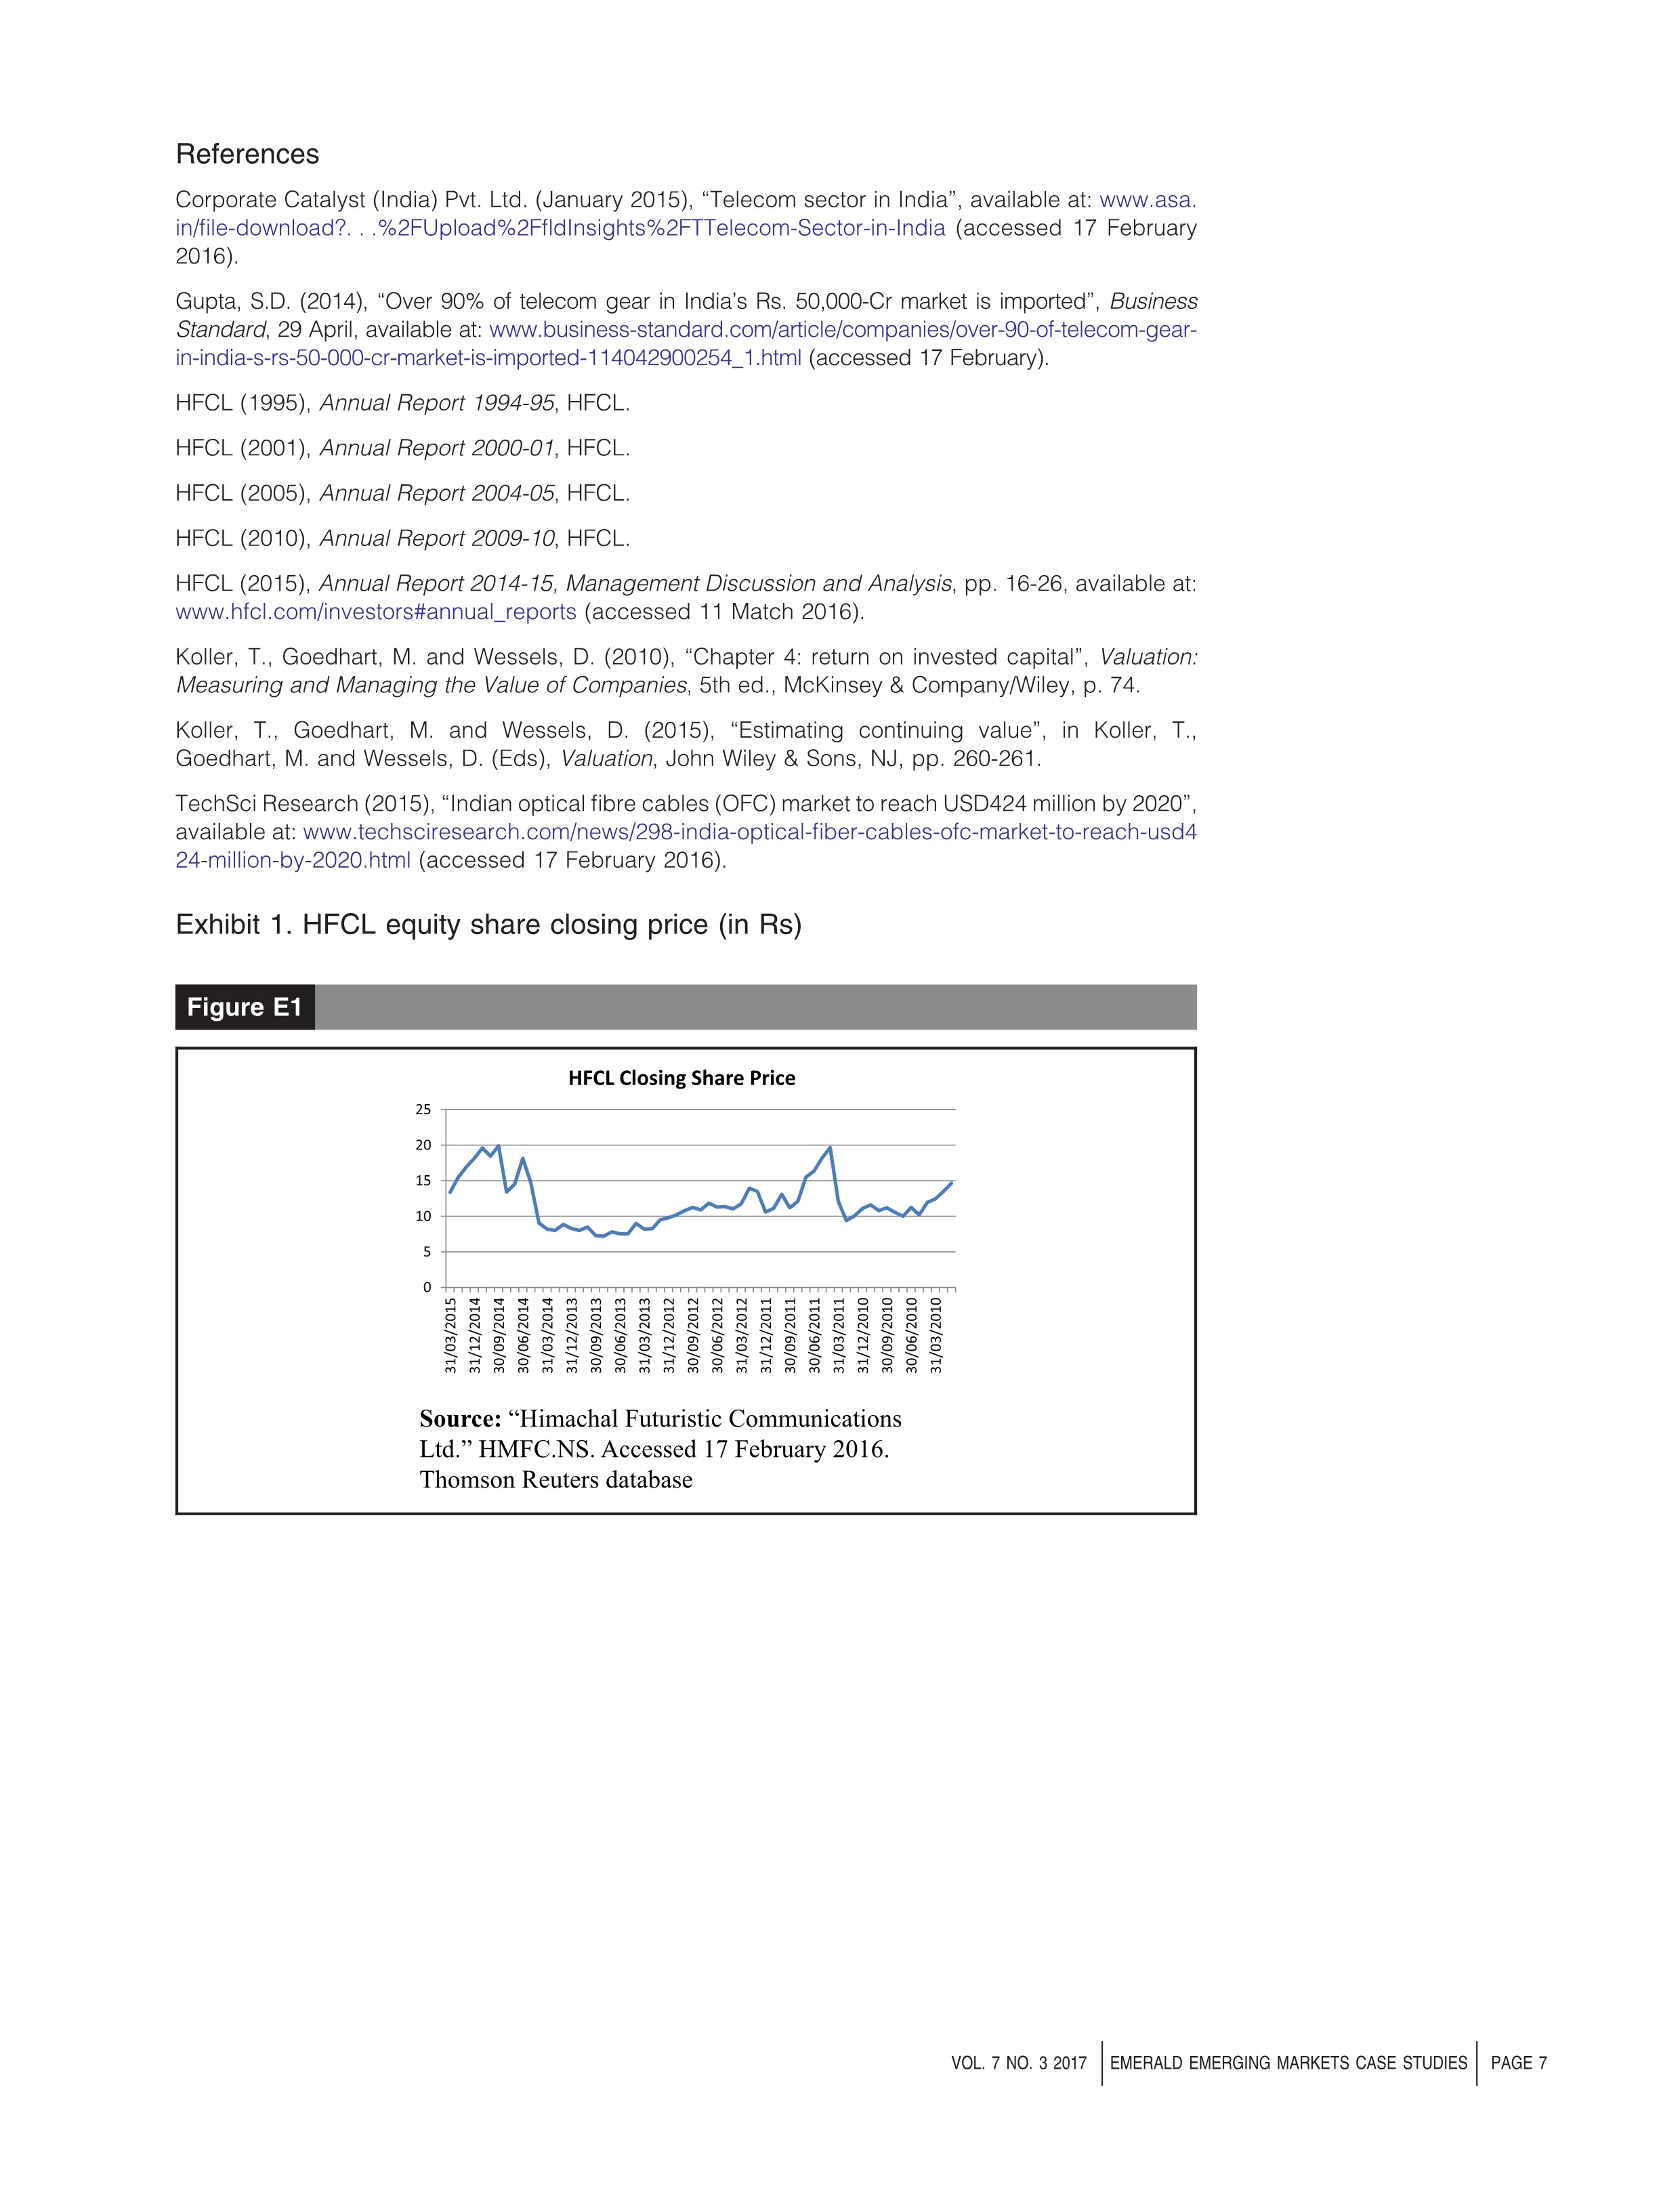
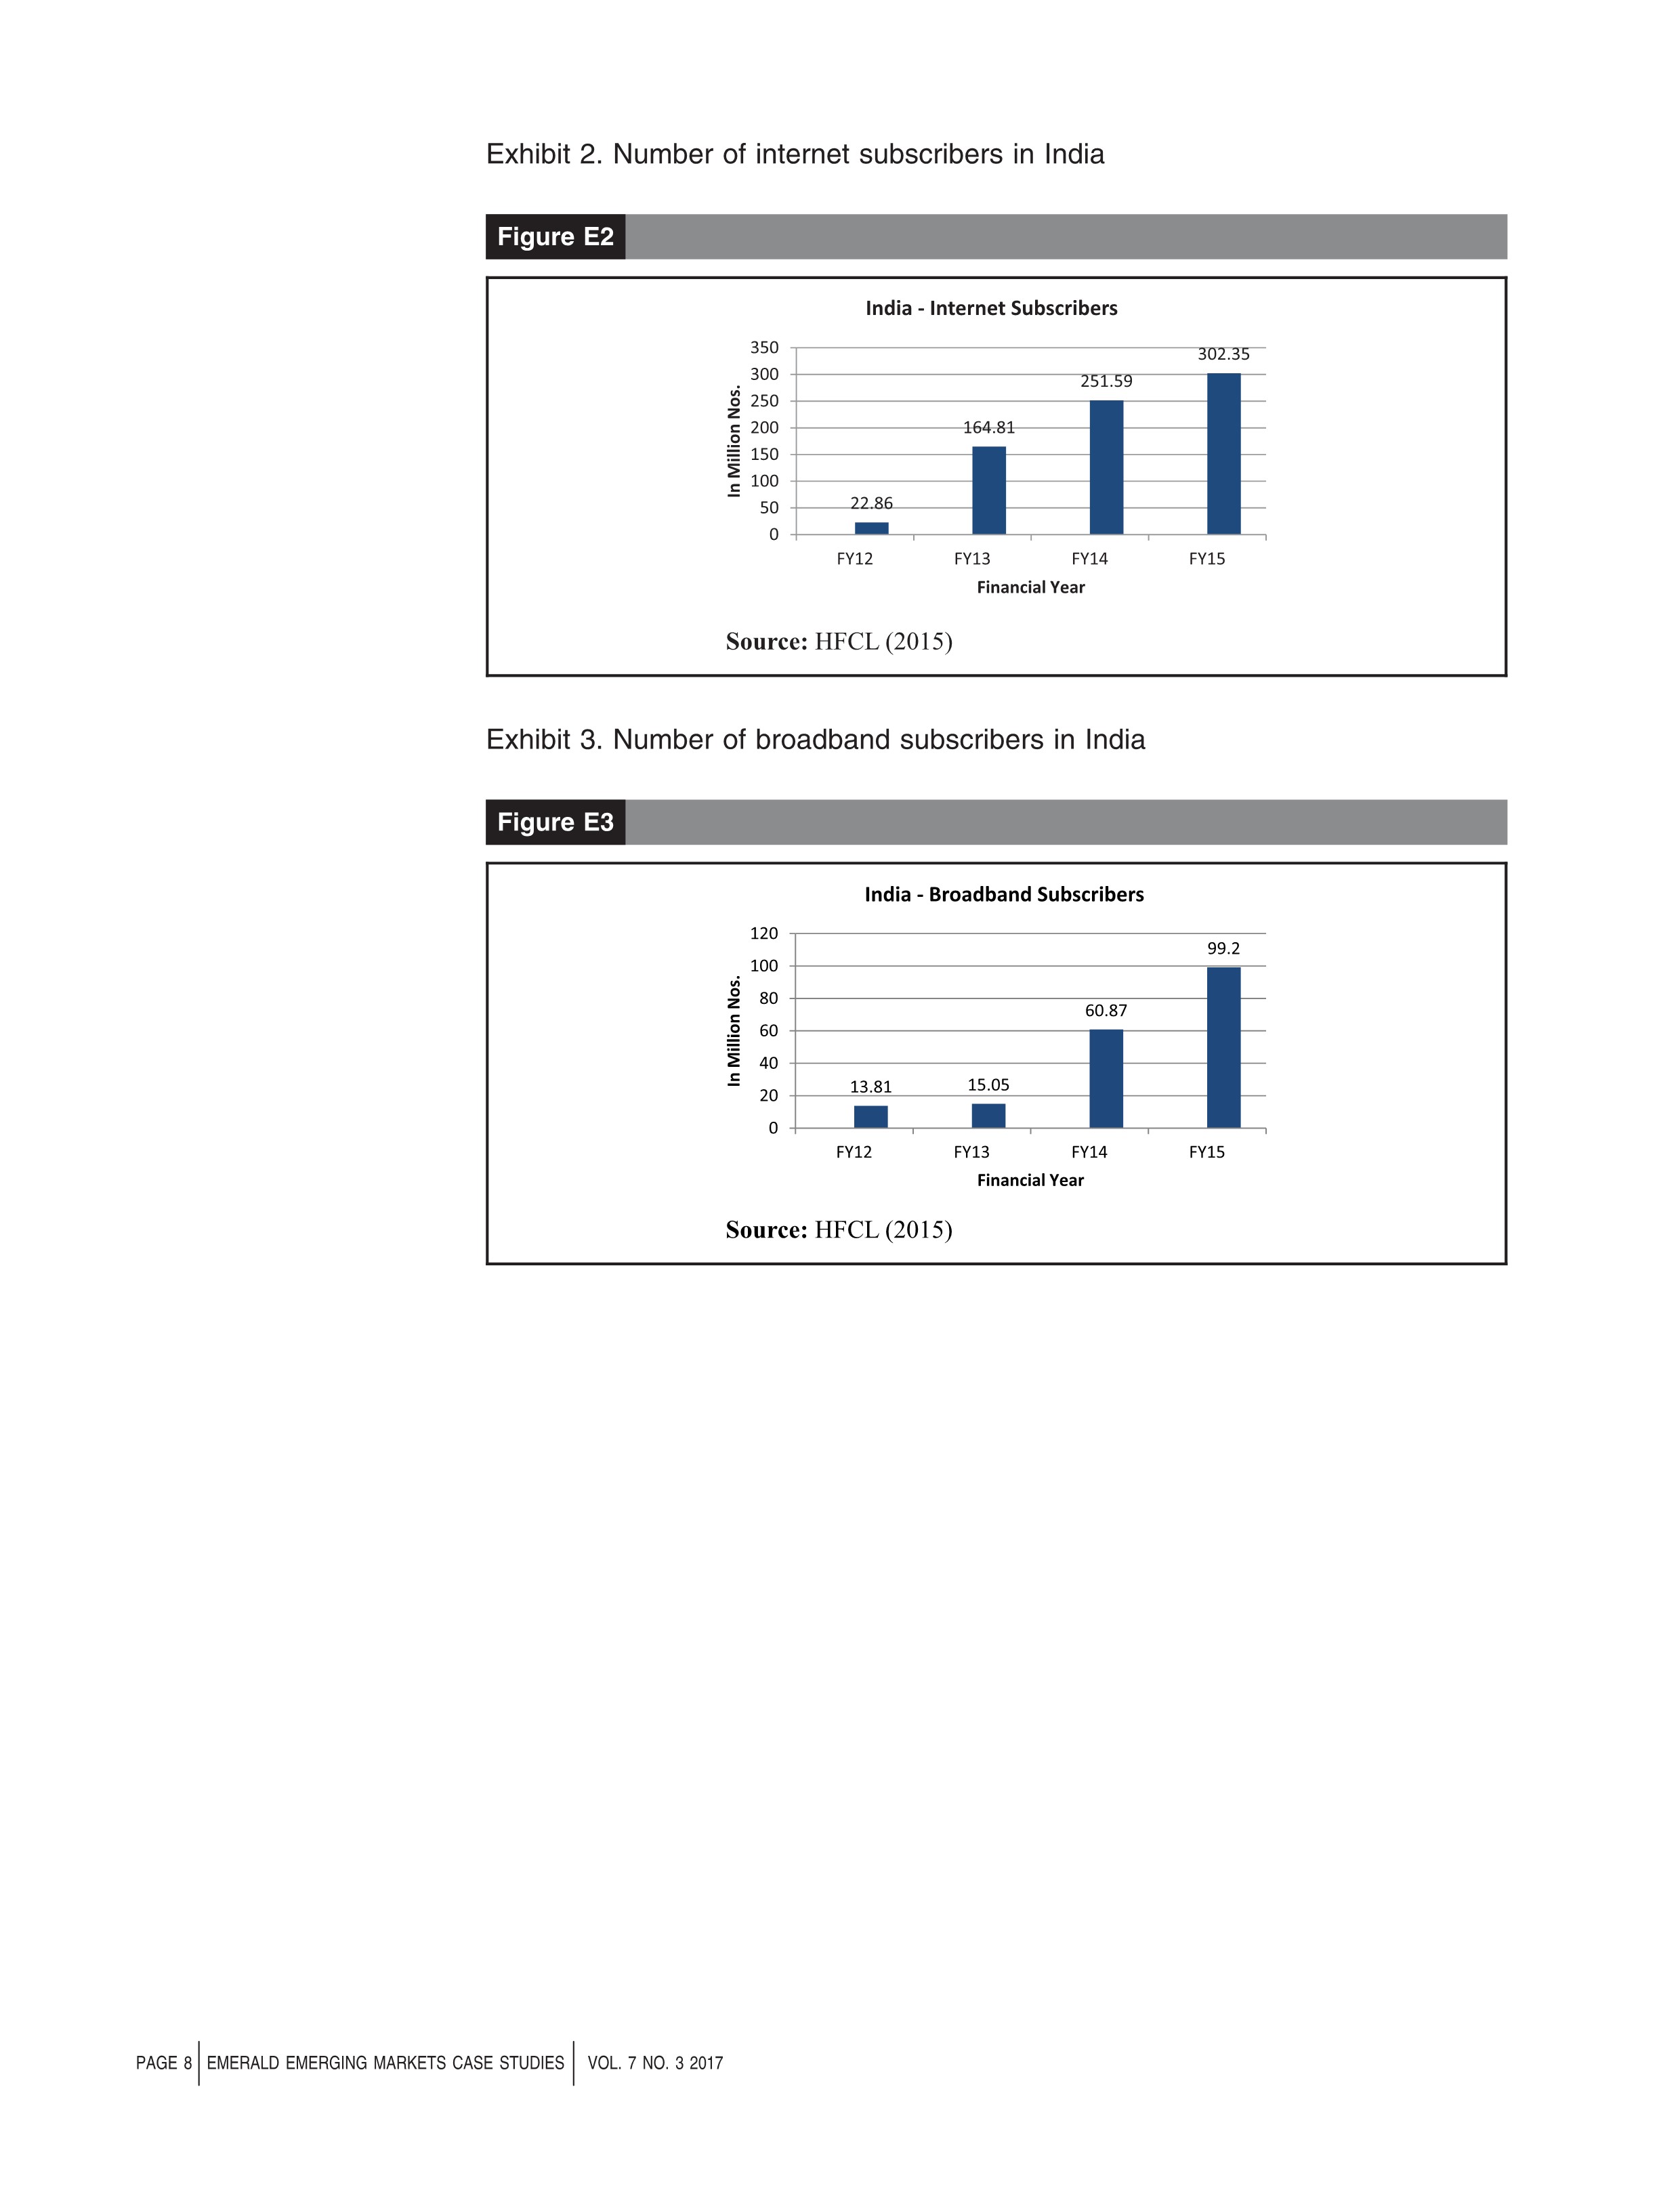
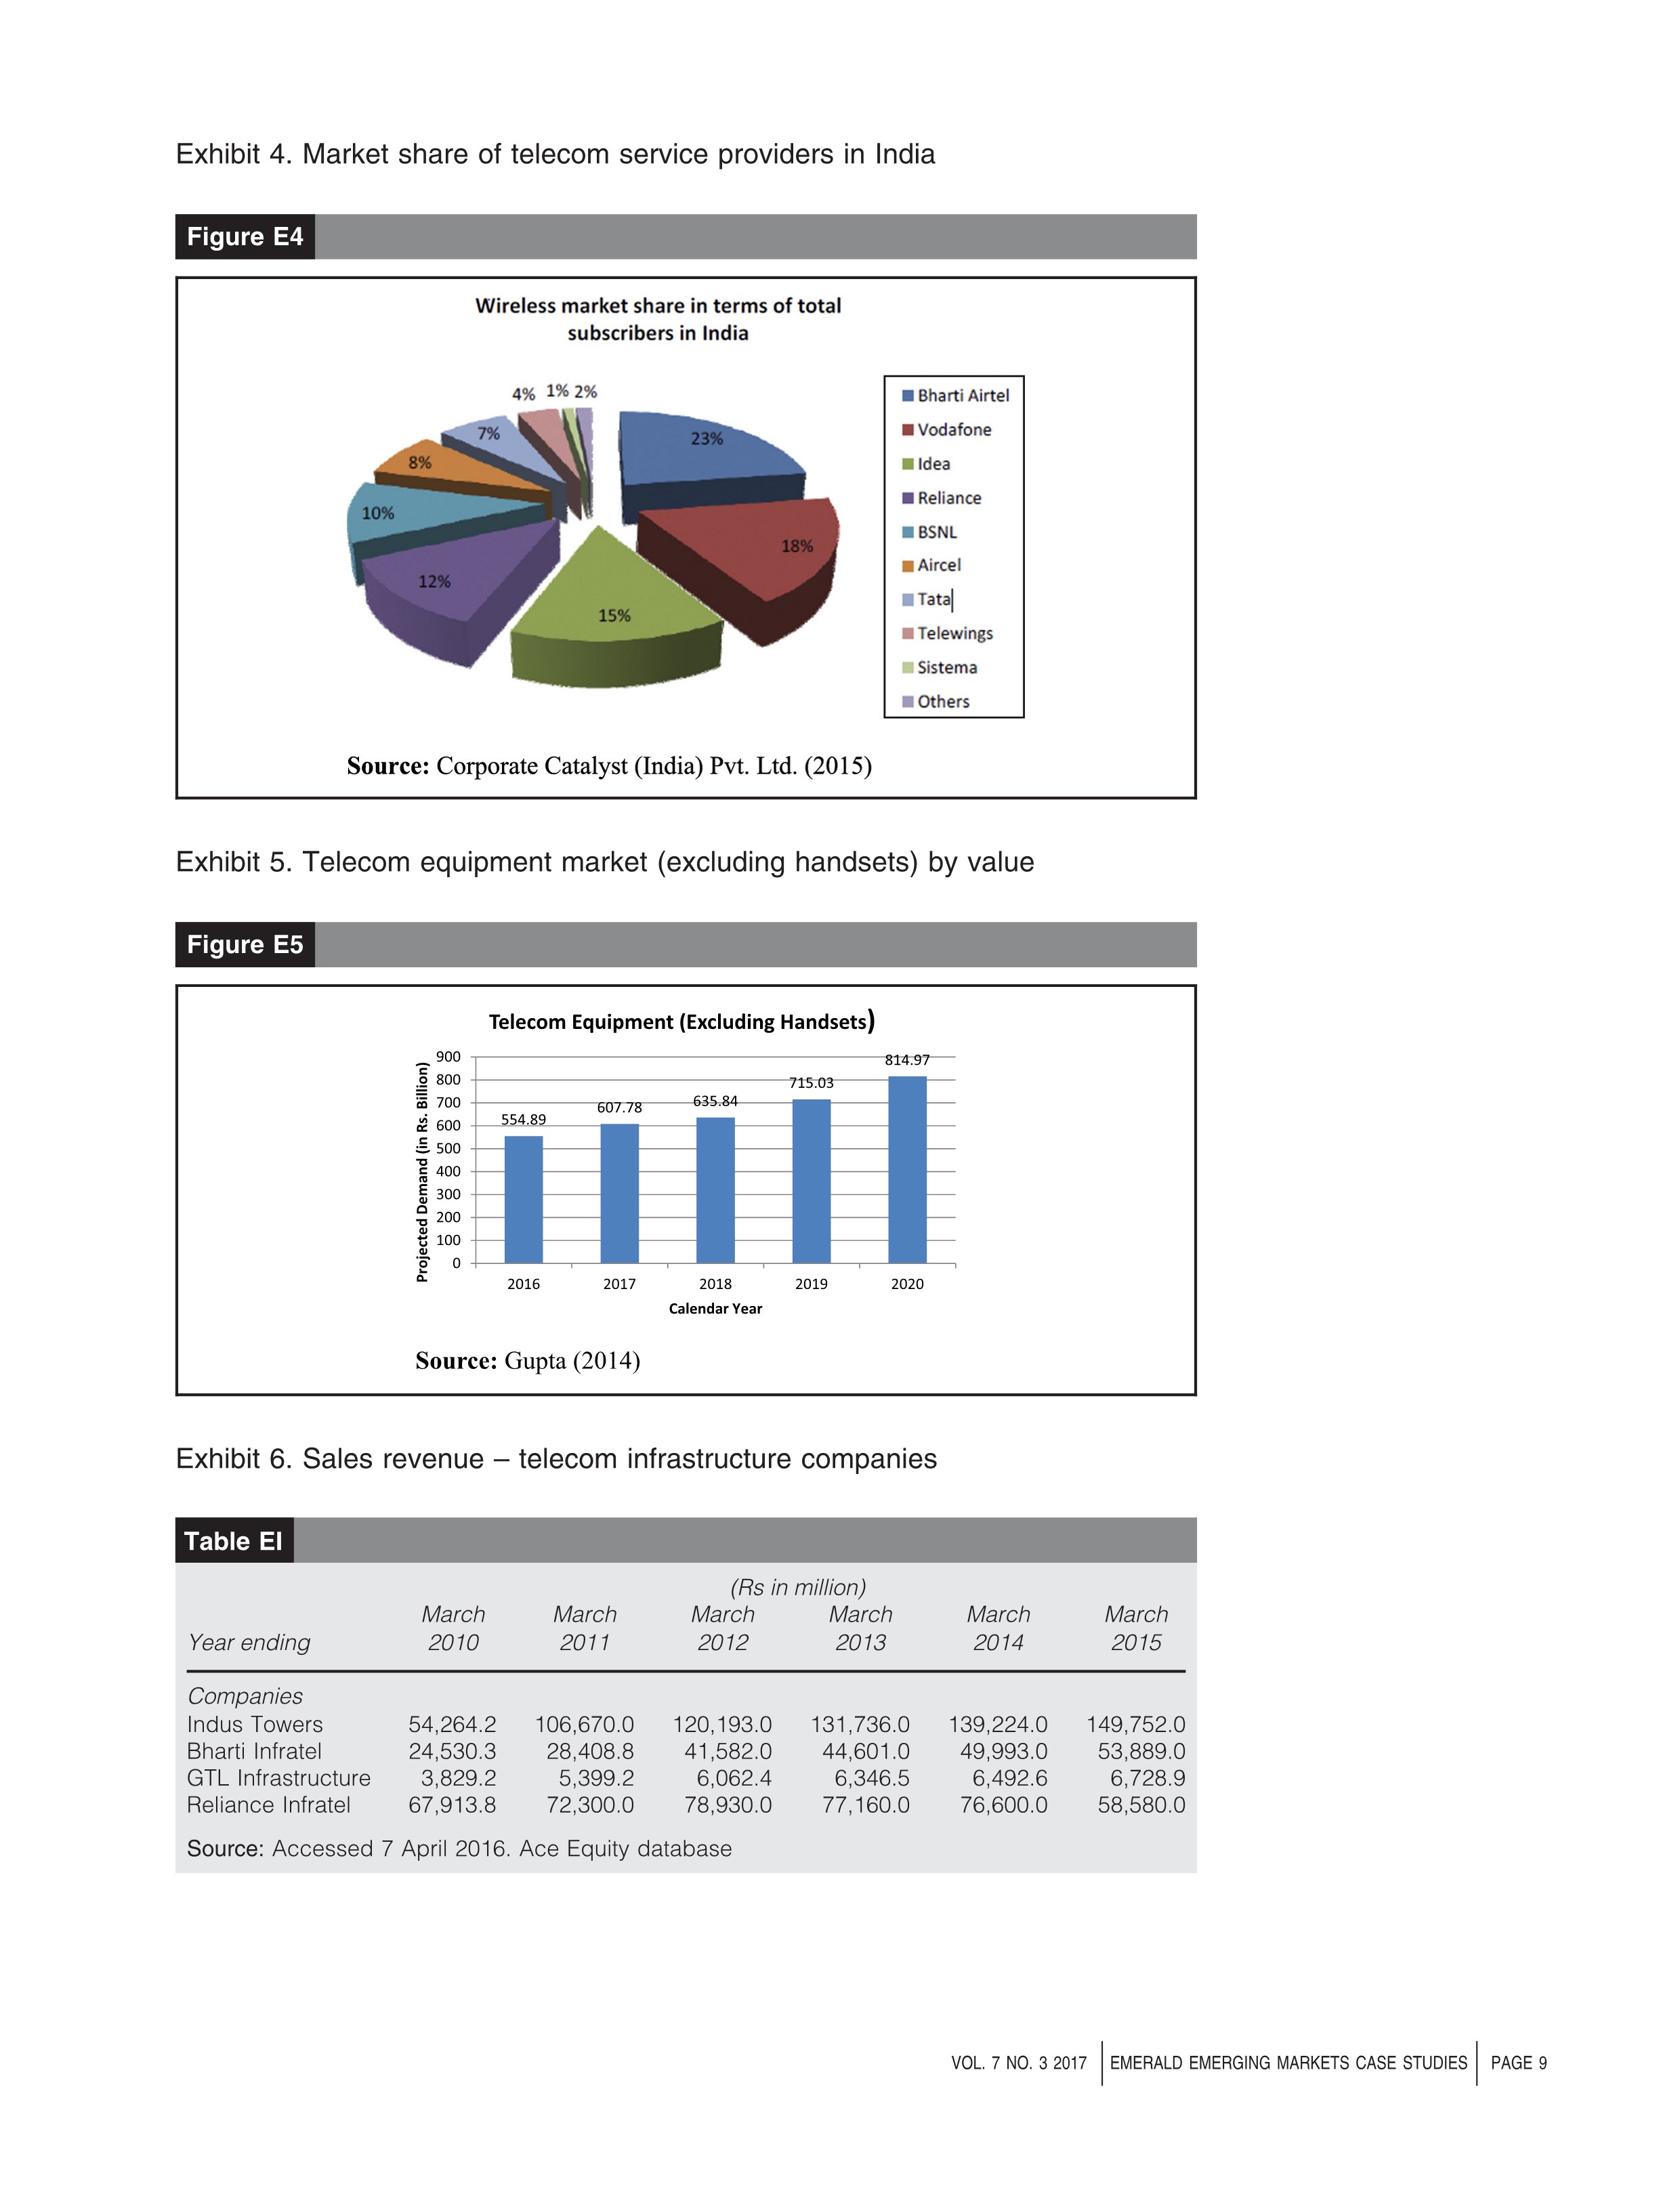
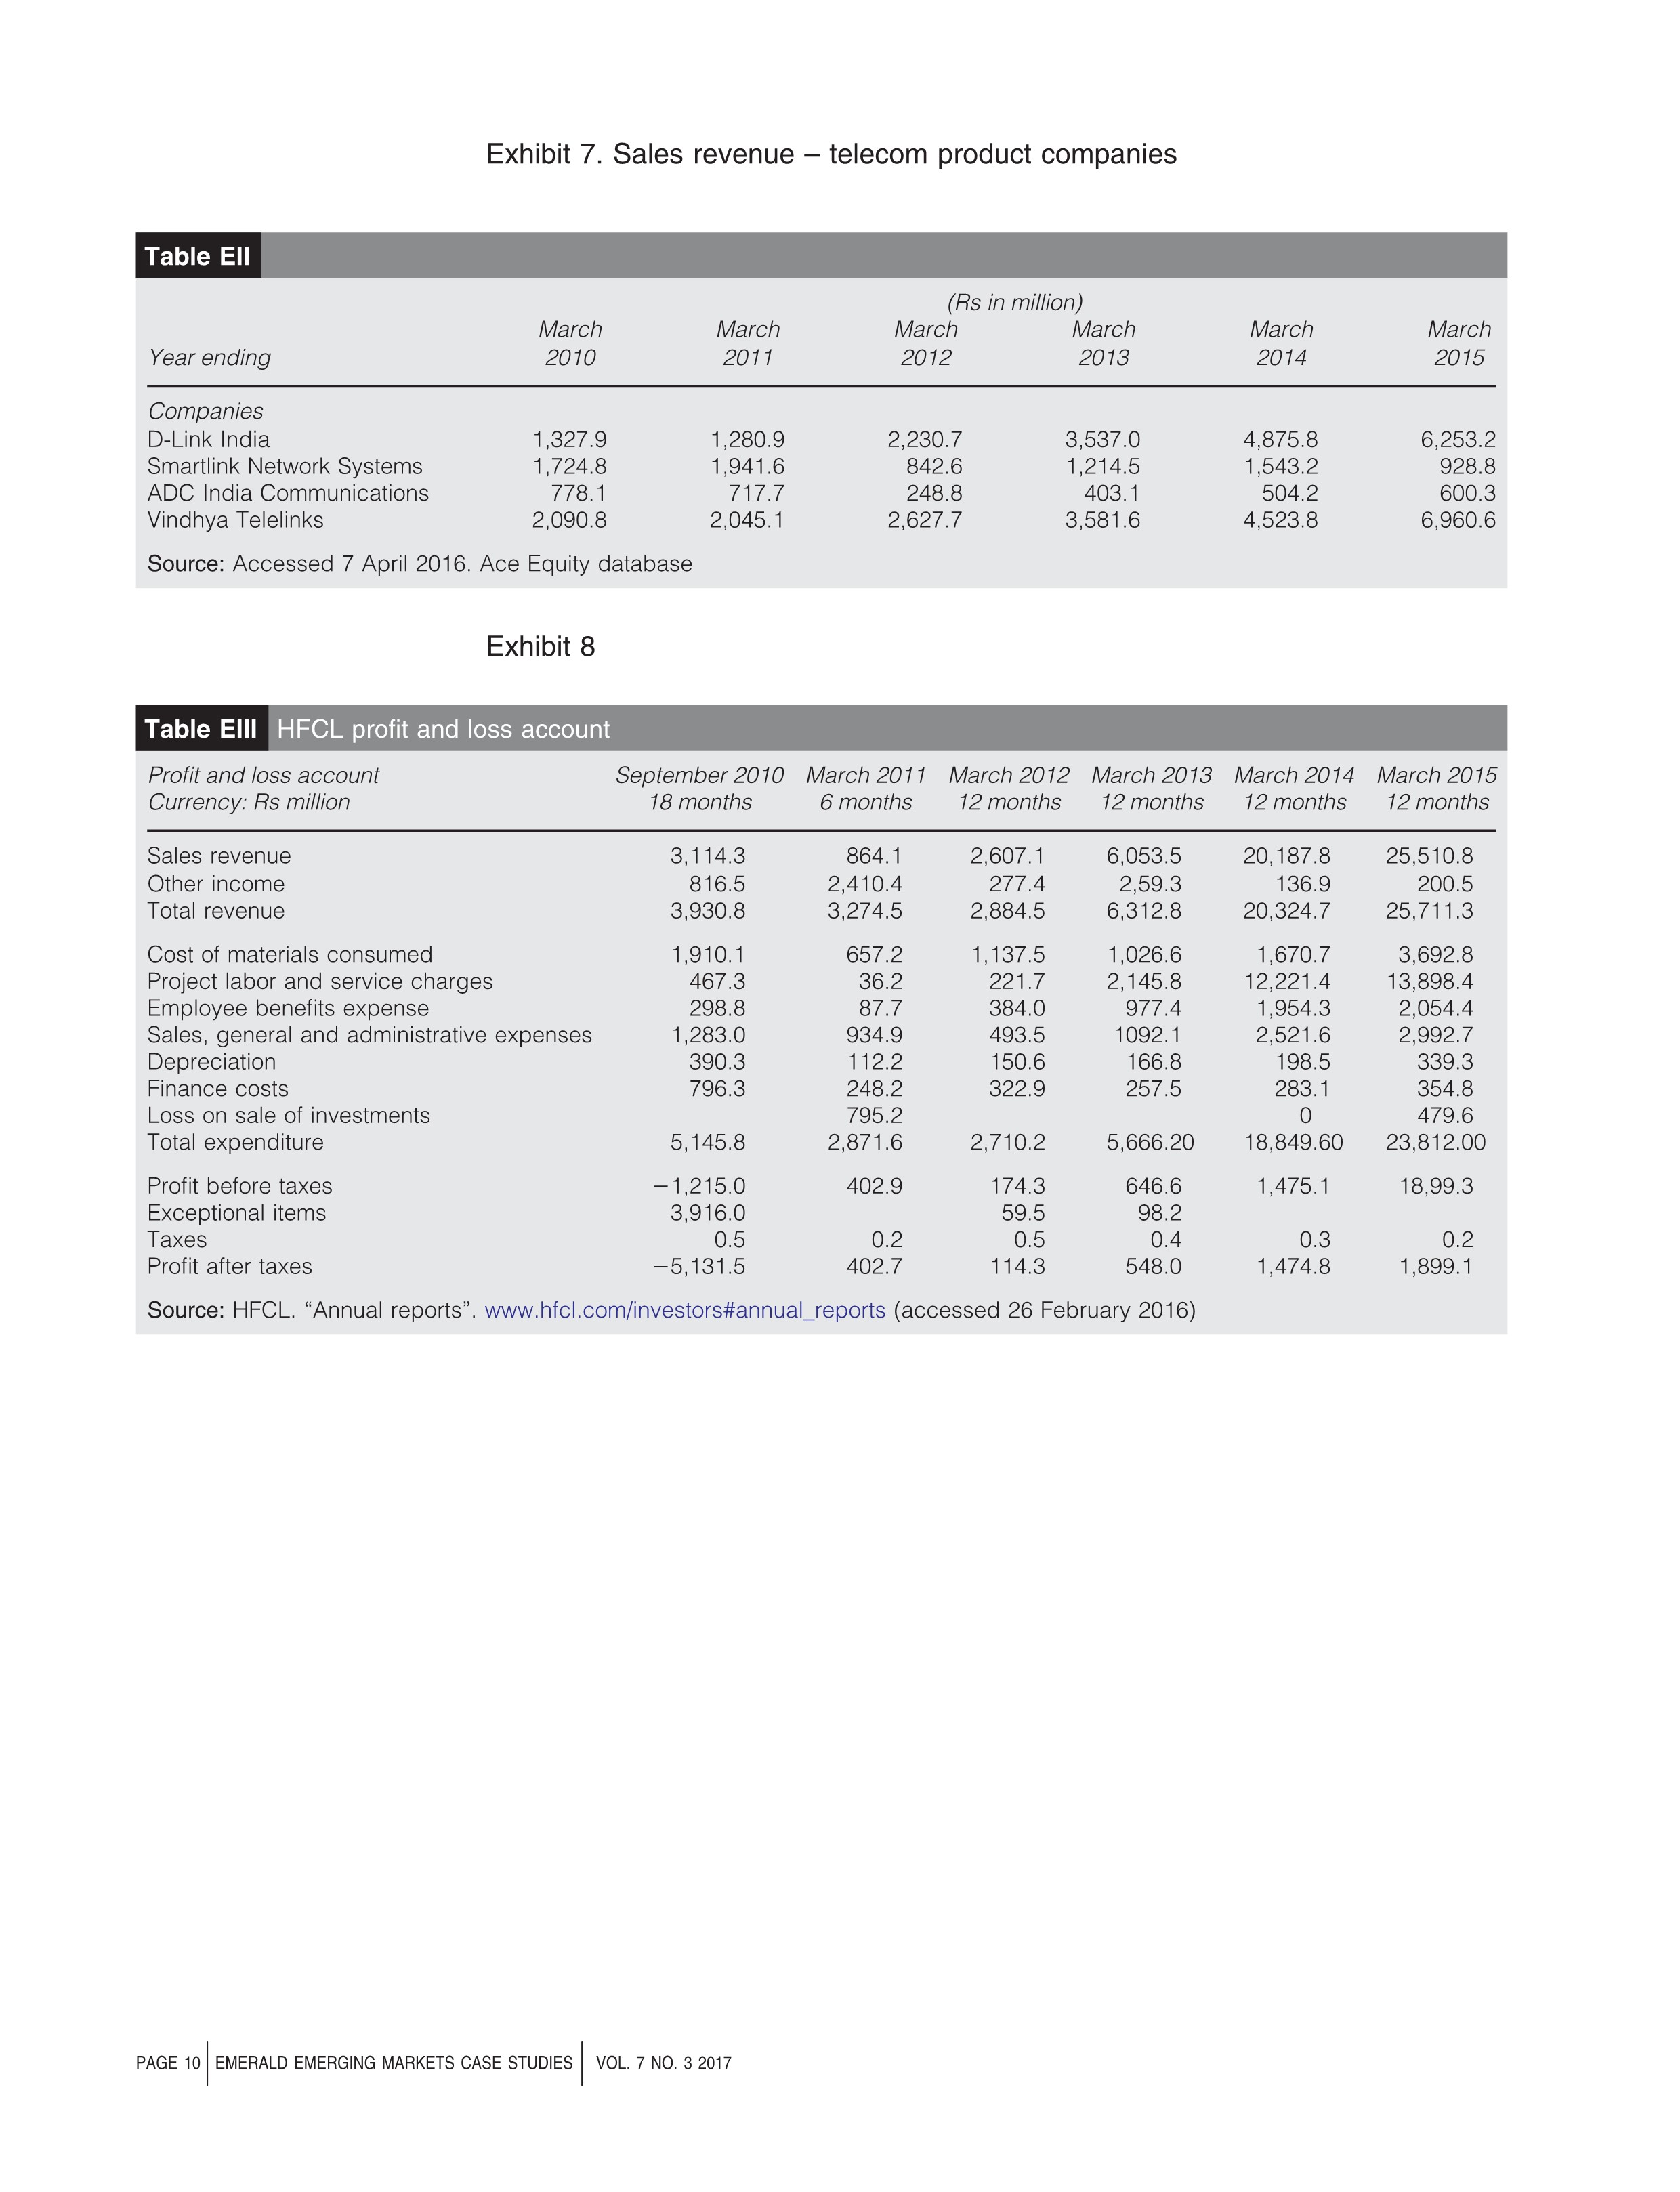
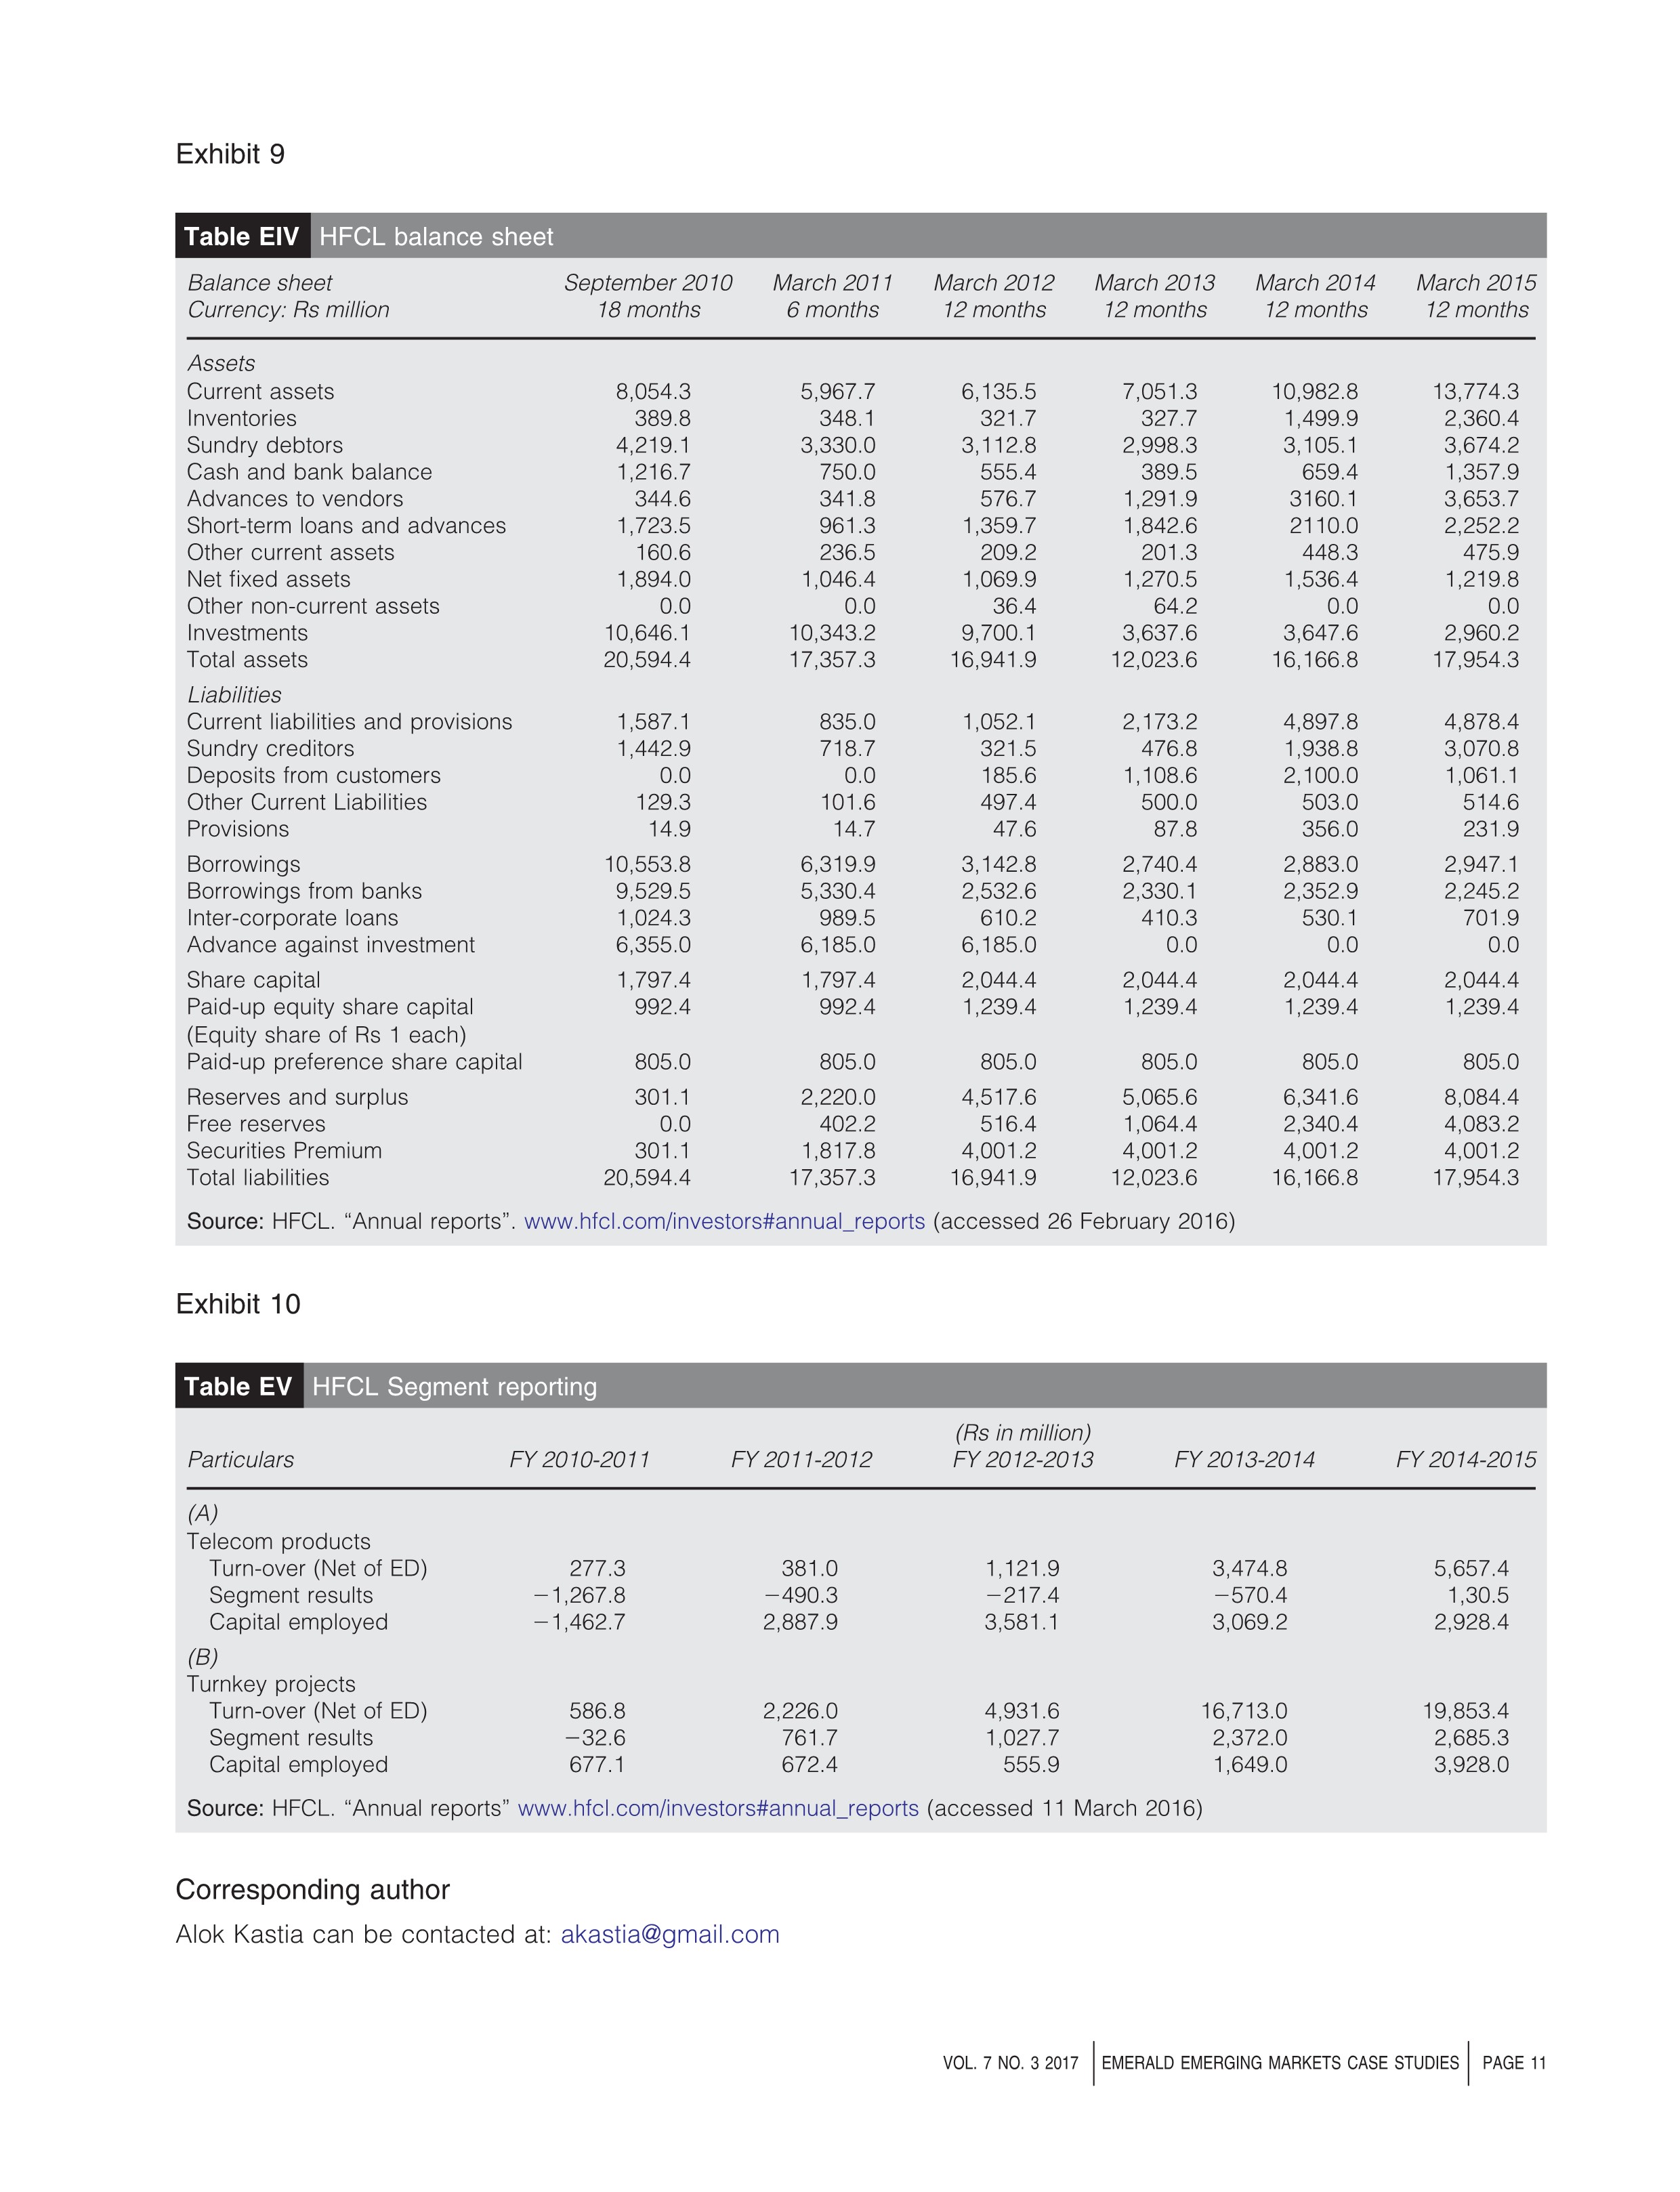 HFCL: valuing a high growth company Alok Kastia Himachal Futuristic Communications Ltd. (HFCL) went for business restructuring and corporate debt restructuring in FY[1] 2009-2010 owing to the heavy losses and its reserves being completely wiped out, showing nil balance. In FY 2011-2012, HFCL completely changed its business model and it entered into manufacturing of equipment for mobile telephony and implementing turnkey projects. HFCL discontinued all of its old products, which were for landline telephony. This complete change in product line was like a re-birth for the company. HFCL found success in both the segments: telecom products for mobile telephony and turnkey projects. Between FY 2012 and FY 2015, HFCL's sales grew by 114 per cent CAGR (compound annual growth rate), EBITDA increased by 64 per cent CAGR and net profit increased by 159 per cent CAGR (HFCL, 2015). HFCL share price (Rs 1 equity par value) grew from Rs 11.75 in March 2012 to Rs 19.90 in September 2014 on the back of the company registering high growth in sales turnover, EBITDA and PAT. The share price came down in March 2015 to Rs 13.35 (Exhibit 1) because the market was sceptical about HFCL sustaining this growth in the future, in the long-run. In March 2015, Rajesh Choudhary, an equity analyst, was wondering whether HFCL shares would regain the height witnessed in September 2014 and whether he should recommend this share to his clients to buy this stock for the medium- to long-term horizon. He was wondering how to value a stock which had shown tremendous growth in the recent past but where there was a great deal of uncertainty associated with it for the future. If somehow he could value the stock properly, he would be able to advise his clients appropriately about HFCL. Indian telecom equipment industry The telecom industry in India had been one of the biggest success stories in the world. The tele-density in 1994 in India was meagre 0.8 per 100 people, which had risen to 79 per 100 people in 2015 (HFCL, 2015), in a span of just 21 years. India today was the second biggest telecom market in the world with an annual service revenue of Rs 2,550bn in FY 2015 (HFCL, 2015). It had recorded an annual growth rate of 10 per cent in FY 2015 as compared to FY 2014 (HFCL, 2015). The mobile segment had dominated the telecom industry with 97 per cent of revenue, while the fixed-line revenue was just 3 per cent (Corporate Catalyst (India) Pvt. Ltd., 2015). The industry had moved from subscribers utilizing voice services to subscribers demanding data services at a high speed. This phenomenon had led to tremendous growth in internet subscribers and broadband subscribers in India. Internet subscribers grew from 22.86 million in FY 2012 to 302.35 million in FY 2015 in a span of four years (Exhibit 2). In the same time, broadband subscribers increased from 13.81 million to 99.2 million (Exhibit 3). This increase clearly showed a huge growth potential in data services, which would mean a tremendous opportunity for telecom Alok Kastia is Associate Professor at the Department of Finance, Institute of Management Technology Ghaziabad, Ghaziabad, India. Disclaimer. This case is written solely for educational purposes and is not intended to represent successful or unsuccessful managerial decision-making. The author/s may have disguised names; financial and other recognizable information to protect confidentiality. Names of employees mentioned in the case have been changed to maintain confidentiality. equipment and optical fibre cable[2] (OFC) manufacturers and for turnkey service providers for laying down 3G/4G[3] telecom networks. The main customer for the industry were the telecom service providers. Telecom service providers had a market share in India as shown in Exhibit 4. This sector had attracted foreign direct investment (FDI) of approximately US \\( \\$ 17 \\mathrm{bn} \\) in the past 15 years (HFCL, 2015). The foreign investors could now invest up to 100 per cent of the equity capital in this sector (HFCL, 2015). This FDI policy had made the telecom sector a very attractive proposition for foreign investors. Despite considerable progress in the telecom sector, almost 25 per cent of the Indian population had no access to mobile services, especially in remote rural and tribal areas. Geographically, 15 per cent of the country's area had not been covered by mobile services (HFCL, 2015), and broadband penetration was very low in the country. Therefore, large amounts of investments were still needed in telecom infrastructure to cover the whole of India. Government initiatives - Digital India program: This program had been designed to give internet access to all the people in the country by connecting 250,000 villages through the telecom network. The main emphasis of this program was broadband, mobile services and internet access to everybody across the country. The total outlay of this program was Rs 1,130bn (HFCL, 2015). - Smart City program: This program had been launched to make, 100 cities identified from all parts of the country, Smart Cities. One of the main things to make the city Smart was to make the city digital by broadband connectivity, latest mobile services and internet access to all in the city. The total investment for this project was Rs 480bn (HFCL, 2015). - Make in India program: The Government had identified \"Telecom Equipment manufacturing\" as a key focus area under this program. The total telecom equipment market in India excluding handsets was approximately Rs 500bn in the year 2015. Out of this, Indian manufacturers had just 3 per cent market share. If we add the share of foreign companies who were manufacturing in India, the domestic manufacturers' share increased to 15 per cent (HFCL, 2015). These data meant that approximately 85 per cent of the telecom equipment demand was being met through imports from other countries like China, Sweden and the USA. This program was meant to increase the Indian manufacturers' share to 60 per cent in the next five-year period. The projected telecom equipment market excluding mobile and landline handsets was expected to grow to Rs \\( 814.97 \\mathrm{bn} \\) in a span of five years (Exhibit 5). This expected growth meant a CAGR of 10.26 per cent over a period of five years. Future prospects The future growth of the Indian telecom sector would now be in rural areas and laying down a network for 3G/4G telecom services. To achieve 100 per cent connectivity with the rural areas, 150,000 more towers would be required on a pan-India basis. This accomplishment would fulfil the objectives of the Digital India program. The telecom service operators were currently spending approximately Rs 5,600bn on towers and other infrastructure each year (HFCL, 2015). India currently has 130 million 3G-enabled devices, but there were only 69.9 million 3G connections (HFCL, 2015). Similarly, India has 5.5 million 4G-enabled devices, but only 85,000 4G subscribers (HFCL, 2015). These data indicate that there was a big opportunity available to convert the remaining \\( 3 G / 4 G \\) device owners to \\( 3 G / 4 G \\) subscribers by rolling S CASE STUDIES VOL. 7 NO. 32017 out 3G/4G services to other parts of India. Device growth was moving faster than the network growth, which meant that there was a huge opportunity for telecom equipment suppliers and EPC (Execution, Procurement and Commissioning) contractors to grow and capitalize on this market of laying down the telecom network. The OFC market in India would be to the tune of Rs 28bn by the year 2020 (TechSci Research, 2015). The projects such as National Optical Fibre Network, National Fibre Spectrum and the roll-out of 4G telecom services would give a boost to the demand of OFC in India. India currently had an OFC market of around 20 million fibre \\( \\mathrm{km} \\) with a turnover of Rs \\( 10 \\mathrm{bn} \\). The OFC market was expected to grow @ 13 per cent CAGR and reach Rs 15bn by the year 2018 (TechSci Research, 2015). Competitive landscape The telecom equipment manufacturing business in India was being dominated by five foreign players - Ericsson, Nokia-Siemens, Alcatel-Lucent, Huawei and ZTE. There were many small domestic Indian manufacturers too. Few of the domestic players were HFCL, Vindhya Telelinks, D-Link India, Smartlink Network Systems and ADC India Communications. Foreign players were big in size and so they would manufacture telecom equipment almost 30 per cent cheaper than the domestic players because of the economies of scale. Also, there was zero duty on the import of finished telecom equipment, whereas there was 10 to 15 per cent duty on the import of telecom components in India (Gupta, 2014). Chinese manufacturers would obtain long-term loans @ 2 to 3 per cent interest rate from Chinese banks, whereas domestic Indian manufacturers would pay 16 to 18 per cent interest rate for term loans to Indian banks (Gupta, 2014). Because of such low rates of interest being enjoyed by the Chinese companies, they could afford to invest a large amount on R\\&D activities. Also, Chinese banks extended suppliers' credit at concessional terms to the buyers of telecom products from Chinese companies. Indian telecom manufacturers would not get such support from Indian banks. As international players were huge globally and their Indian operations were small when compared to their total world-wide operations, these companies cannot be studied to make any future revenue projections of HFCL. For this purpose, telecom infrastructure companies in India were being taken as a proxy for the turnkey projects segment. The sales revenue of telecom infrastructure companies for the past five years is shown in Exhibit 6. Similarly, for the telecom products segment, the manufacturers of OFC, routers, adapters, switches and telecom fibre accessories were taken as a proxy for telecom products segment. The sales revenue of such companies for the past five years is mentioned in Exhibit 7. Himachal Futuristic Communications Ltd. (HFCL) HFCL started its operations of telecom equipment manufacturing for landline telephony in 1988-1989. It was quite successful in the 1990s and its turnover increased to Rs \\( 1,000 \\mathrm{~m} \\) in 1995 (HFCL, 1995). In 2001, its turnover was Rs 12,942m (HFCL, 2001), but now the landline telephony usage was on a decline. The customers were buying more mobile phones and per cent share of landline phones in the total telecom market started decreasing rapidly. As a result, the turnover of HFCL declined to Rs \\( 4,227 \\mathrm{~m} \\) in \\( F Y \\) 2004-2005 (HFCL, 2005). In FY 2009-2010, the company had a meagre turnover of Rs 3,114m (HFCL, 2010) with reserves completely wiped out, showing nil balance. So the company completely changed its product line and created two business segments: telecom products and turnkey projects. Telecom products The company started producing OFC in its Goa plant. The company had a capacity of 5.4 million fibre km of OFC per annum in FY 2014 (HFCL, 2015), which was fully utilized in FY 2015. The company would increase its capacity of OFC to 9.0 million fibre \\( \\mathrm{km} \\) to take advantage of the huge demand of OFC in future by putting up a plant in Chennai (HFCL, 2015). Exports of OFC would also be stressed upon to leverage great opportunity for the sale of OFC in the international markets. In telecom equipment manufacturing, the company would focus on microwave radios and optical transport equipment, which were being used for laying down GSM networks for 3G/4G services. HFCL had a technical tie-up with DragonWave Inc., a Canadian company for microwave radios. The company had been manufacturing microwave radios and optical transport equipment since 2011-2012. HFCL was able to maintain a superior quality of its products because of technical tie-ups and on-time delivery of its products because of operational efficiency. Turnkey projects The government had emphasized on indigenous procurement for defence and on the modernization of railways. The company would bid for EPC contracts in these two segments vigorously in the future. The company would expect a large number of orders from these two verticals in the future. The two initiatives of the Indian Government, Digital India and Smart Cities, would offer a tremendous opportunity for turnkey projects. The company would want to bid aggressively for EPC contracts under these two initiatives and hope to gain significant revenue from winning such contracts. The company had a strong team to execute EPC contracts, which it would leverage to its maximum potential. HFCL already had the expertise in managing and maintaining the telecom networks at the highest level of efficiency. HFCL had been concentrating its turnkey project operations in a few states where it was already a market leader. Thereby, \\( \\mathrm{HFCL} \\) could manage to lower its cost of execution by negotiating hard with the local contractors owing to its dominant position in that particular state. HFCL had been utilizing telecom products it was manufacturing to execute EPC contracts, which would enable HFCL to complete the project with superior quality within stipulated time given by its customers. Business risks of the company. Although the company had a considerable potential to grow in terms of revenues and profits, it was exposed to some risks. First, there was stiff competition from international players and small domestic players in the tender-based business[4]. Second, the equipment suppliers ran the risk of delay in completion of orders which would attract huge penalties. Third, foreign companies might tie-up with other indigenous equipment suppliers or set-up their own manufacturing facilities in India (HFCL, 2015). HFCL stock - valuing high growth company HFCL became a high growth company because of its completely different business model since FY 2011-2012. Revenue grew from FY 2011-2012 to FY 2014-2015 at CAGR of 114 per cent. Typically, high growth companies are those whose organic revenue growth exceeds 20 per cent annually. For a high growth company, historical financial results would provide limited insight about future prospects of the company. Therefore, to value a high growth company, one would begin by estimating the size of the potential market, predict the level of sustainable profitability and estimate the investments necessary to achieve targeted sales. Then after \\begin{tabular}{l|l} ISE STUDIES & VOL. 7 NO. 32017 \\end{tabular} developing a long-term future view, work backward to connect the future to current performance. Given the level of uncertainty, one would develop multiple scenarios based on estimated revenues, returns generated on newly invested capital (RONIC) and the long-term growth rate. Choudhary had analysed the industry by collecting the revenue data (Exhibits 6 and 7) for the main companies within the industry. He then developed three scenarios based on the revenue growth projections and RONIC for the company. Choudhary had already collected the past income statement (Exhibit 8) and the past balance sheet (Exhibit 9) about the company. The segment-wise revenues, operating profits and capital employed are shown in Exhibit 10. He had estimated the Beta[5] for the company to be 1.30 for one year and the average market risk premium[6] as 5 per cent for India. The 10-year government securities benchmark yield[7] as on 31 March 2015 was 7.66 per cent p.a. Choudhary projected the income statement based on the ratios of operating expenses to revenue for the year FY 2014-2015. Raw material consumed was taken based on revenue from telecom products and outsourced manufacturing jobs was taken based on revenue from turnkey projects, in FY 2014-2015. The depreciation was calculated as per cent of net fixed assets in line with FY 2014-2015. Interest expense was calculated at 10 per cent incremental cost of debt. The income tax expense was calculated at the marginal corporate tax rate of 30 per cent. The cumulative redeemable preference shares[8] carried a dividend rate of 6.5 per cent p.a. and would be redeemed at the rate of 25 and 75 per cent in FY 2017-2018 and FY 2018-2019, respectively. The equity dividend pay-out could be taken based on a reasonable assumption depending on the specific scenario. Choudhary projected the working capital requirement based on customer's collection period days, inventory holding period days and supplier's credit days as in FY 2014-2015. Advances to vendors were calculated as per cent of revenues in line with FY 2014-2015. Deposits from customers were estimated as per cent of turnkey project revenues in line with FY 2014-2015. Choudhary projected the net fixed assets as per cent of revenues in line with FY 2014-2015. The debt was estimated based on debt to EBIDTA (Earnings before Interest, Depreciation, Taxes and Amortization) ratio of FY 2014-2015. Continuing value Choudhary now turned his attention to ascertain the continuing value of the company, which would be a major component in the total value of the company. He decided to estimate the continuing value (CV; Koller et al., 2015) using the value driver formula: \\[ \\mathrm{CV}=\\operatorname{NOPLAT}_{\\mathrm{t}+1}(1-\\mathrm{g} / \\mathrm{RONIC}) /(\\mathrm{WACC}-\\mathrm{g}) \\] NOPLAT \\( _{\\mathrm{t}+1}= \\) net operating profit less adjusted taxes in the first year after the explicit forecast period; g \\( \\quad= \\) expected growth rate in NOPLAT in perpetuity; RONIC = expected rate of return on new invested capital; and WACC \\( = \\) weighted average cost of capital. The RONIC would be ascertained based on three scenarios. The RONIC would differ across three scenarios based on the competitive structure of the industry and whether the company would be able to retain its competitive advantage vis--vis its rivals in the long run. Theoretically, long-term growth rate \\( (\\mathrm{g} \\) ) for the company would be a product of return on invested capital (ROIC) and its reinvestment rate (IR). However, g would be constrained by the growth in the product market in which the company operates, in the long run. Therefore, \\begin{tabular}{l|l} VOL. 7 NO. 32017 & EMERALD EMERC \\\\ \\end{tabular} \\( g \\) would be lower of the theoretical value or the constraint for each scenario. It was assumed that HFCL would continue to operate in the same product category and the same product market (that is India) in the long term. Choudhary, with all the knowledge at his disposal, started to value this high growth company using a scenario-based discounted cash flow (DCF) valuation technique. He would develop three scenarios to capture the uncertainty associated with a high growth company. He would then estimate enterprise value and implied equity value for each of the scenarios based on the DCF technique. Choudhary would also estimate the probability of occurrence for each scenario based on the historical performance of other high growth companies. Ultimately, he would calculate the probability-weighted expected value of the share. He wondered whether the intrinsic value of the share so calculated would be below or above the market price of the stock as on 31 March 2015. Ultimately, that would decide his recommendation to the clients. Notes 1. FY (Financial Year): It is a period of one year for which the financial statements are prepared. It typically starts from April 1 of each year and ends at March 31 of the following year. For example, FY 2009-2010 will typically start on 1 April 2009, and end on 31 March 2010. 2. Optical fibre cable: Optical fibre cable contains one or more optical fibres that are used to carry light. The data can be transmitted at a very high speed through refraction of light. 3. 3G and 4G: 3G technology is the third-generation mobile technology that is used to transfer data other than voice signals. 4G technology is the fourth-generation technology, which is faster and more advanced than 3G. 4G technology enables the use of video calls and mobile TV. 4G uses more bandwidth than 3G. 4. Tender-based business: The buying organization floats a tender to invite all potential suppliers to bid for a contract to supply certain good or services. The contract is normally awarded to the supplier who quoted the lowest price, all other things being equal vis--vis other suppliers. 5. \"Himachal Futuristic Communications Ltd.\" HMFC.NS. Accessed 3 March 2016, Thomson Reuters database. 6. The Market Risk Premium has been taken from the perspective of a Global Investor. India has become increasingly integrated with the global capital markets because of foreign institutional investors (FIIs) investing billions of US dollars in the Indian equity market. As country risk are diversifiable from the perspective of a global investor, we need no additional country risk premium for India, other than the global estimate of market risk premium. The global estimate of average market risk premium is 5 per cent [This whole assertion is mentioned in the Book referred to in the Teaching Note \"Suggested Readings\" (a)]. So, Market Risk Premium of 5 per cent has been assumed in the case, for the sake of simplicity. 7. \"10-year G-Sec Benchmark yield\". INR10HYZ=TCCL-Bid. Accessed 3 March 2016. Thomson Reuters database. 8. Originally, the Cumulative Redeemable Preference Shares (CRPS) were issued at the coupon rate of 12 per cent p.a. for Rs 805m in FY 2003-2004. Subsequently, the company went for Corporate Debt Restructuring (CDR) in January 2011. As per the rework package of the CDR, the CRPS would carry a coupon rate of 6.5 per cent p.a. from the CDR cut-off date of 1 January 2011. 9. CAGR: Compound annual growth rate Keywords: Financial analysis/ forecasting, Financial investment/ markets, Financial modelling/ forecasting 10. This finding has been taken from \"Source: Koller et al. (2010)\". I have assumed this for the sake of simplicity, as focus of the case is to illustrate the methodology of valuing a high growth company. 11. HFCL would hit constant growth phase in five years' time because it belongs to Indian telecom equipment industry. This industry would mature in next five years' time because most of the optical fibre network, telecom towers, base transceiver stations (BTS) and telecom infrastructure would be in place throughout the country in the next five years' time. So, for the sake of simplicity, the explicit forecast period has been taken as five years. PAGE 6 | EMERALD EMERGING MARKETS CASE STUDIES | VOL. 7 NO. 32017 References Corporate Catalyst (India) Pvt. Ltd. (January 2015), \"Telecom sector in India\", available at: www.asa. in/file-download? . . \\%2FUpload\\%2FfldInsights\\%2FTTelecom-Sector-in-India (accessed 17 February 2016). Gupta, S.D. (2014), \"Over 90\\% of telecom gear in India's Rs. 50,000-Cr market is imported\", Business Standard, 29 April, available at: www.business-standard.com/article/companies/over-90-of-telecom-gearin-india-s-rs-50-000-cr-market-is-imported-114042900254_1.html (accessed 17 February). HFCL (1995), Annual Report 1994-95, HFCL. HFCL (2001), Annual Report 2000-01, HFCL. HFCL (2005), Annual Report 2004-05, HFCL. HFCL (2010), Annual Report 2009-10, HFCL. HFCL (2015), Annual Report 2014-15, Management Discussion and Analysis, pp. 16-26, available at: www.hfcl.com/investors\\#annual_reports (accessed 11 Match 2016). Koller, T., Goedhart, M. and Wessels, D. (2010), \"Chapter 4: return on invested capital\", Valuation: Measuring and Managing the Value of Companies, 5th ed., McKinsey \\& Company/Wiley, p. 74. Koller, T., Goedhart, M. and Wessels, D. (2015), \"Estimating continuing value\", in Koller, T., Goedhart, M. and Wessels, D. (Eds), Valuation, John Wiley \\& Sons, NJ, pp. 260-261. TechSci Research (2015), \"Indian optical fibre cables (OFC) market to reach USD424 million by 2020\", available at: www.techsciresearch.comews/298-india-optical-fiber-cables-ofc-market-to-reach-usd4 24-million-by-2020.html (accessed 17 February 2016). Exhibit 1. HFCL equity share closing price (in Rs) \\begin{tabular}{l|l|l} VOL. 7 NO. 32017 & EMERALD EMERGING MARKETS CASE STUDIES & PAGE 7 \\end{tabular} Exhibit 2. Number of internet subscribers in India Exhibit 3. Number of broadband subscribers in India PAGE 8 | EMERALD EMERGING MARKETS CASE STUDIES | VOL. 7 NO. 32017 Exhibit 4. Market share of telecom service providers in India Figure E4 Exhibit 6. Sales revenue - telecom infrastructure companies \\begin{tabular}{l|l|l} VOL. 7 NO. 32017 & EMERALD EMERGING MARKETS CASE STUDIES & PAGE 9 \\end{tabular} Exhibit 7. Sales revenue - telecom product companies Exhibit 8 \\begin{tabular}{l|l|l} PAGE 10 & EMERALD EMERGING MARKETS CASE STUDIES & VOL. 7 NO. 32017 \\end{tabular} Exhibit 9 Exhibit 10 Corresponding author Alok Kastia can be contacted at: akastia@gmail.com VOL. 7 NO. 32017 EMERALD EMERGING MARKETS CASE STUDIES \\( \\mid \\) PAGE 11 HFCL: valuing a high growth company Alok Kastia Himachal Futuristic Communications Ltd. (HFCL) went for business restructuring and corporate debt restructuring in FY[1] 2009-2010 owing to the heavy losses and its reserves being completely wiped out, showing nil balance. In FY 2011-2012, HFCL completely changed its business model and it entered into manufacturing of equipment for mobile telephony and implementing turnkey projects. HFCL discontinued all of its old products, which were for landline telephony. This complete change in product line was like a re-birth for the company. HFCL found success in both the segments: telecom products for mobile telephony and turnkey projects. Between FY 2012 and FY 2015, HFCL's sales grew by 114 per cent CAGR (compound annual growth rate), EBITDA increased by 64 per cent CAGR and net profit increased by 159 per cent CAGR (HFCL, 2015). HFCL share price (Rs 1 equity par value) grew from Rs 11.75 in March 2012 to Rs 19.90 in September 2014 on the back of the company registering high growth in sales turnover, EBITDA and PAT. The share price came down in March 2015 to Rs 13.35 (Exhibit 1) because the market was sceptical about HFCL sustaining this growth in the future, in the long-run. In March 2015, Rajesh Choudhary, an equity analyst, was wondering whether HFCL shares would regain the height witnessed in September 2014 and whether he should recommend this share to his clients to buy this stock for the medium- to long-term horizon. He was wondering how to value a stock which had shown tremendous growth in the recent past but where there was a great deal of uncertainty associated with it for the future. If somehow he could value the stock properly, he would be able to advise his clients appropriately about HFCL. Indian telecom equipment industry The telecom industry in India had been one of the biggest success stories in the world. The tele-density in 1994 in India was meagre 0.8 per 100 people, which had risen to 79 per 100 people in 2015 (HFCL, 2015), in a span of just 21 years. India today was the second biggest telecom market in the world with an annual service revenue of Rs 2,550bn in FY 2015 (HFCL, 2015). It had recorded an annual growth rate of 10 per cent in FY 2015 as compared to FY 2014 (HFCL, 2015). The mobile segment had dominated the telecom industry with 97 per cent of revenue, while the fixed-line revenue was just 3 per cent (Corporate Catalyst (India) Pvt. Ltd., 2015). The industry had moved from subscribers utilizing voice services to subscribers demanding data services at a high speed. This phenomenon had led to tremendous growth in internet subscribers and broadband subscribers in India. Internet subscribers grew from 22.86 million in FY 2012 to 302.35 million in FY 2015 in a span of four years (Exhibit 2). In the same time, broadband subscribers increased from 13.81 million to 99.2 million (Exhibit 3). This increase clearly showed a huge growth potential in data services, which would mean a tremendous opportunity for telecom Alok Kastia is Associate Professor at the Department of Finance, Institute of Management Technology Ghaziabad, Ghaziabad, India. Disclaimer. This case is written solely for educational purposes and is not intended to represent successful or unsuccessful managerial decision-making. The author/s may have disguised names; financial and other recognizable information to protect confidentiality. Names of employees mentioned in the case have been changed to maintain confidentiality. equipment and optical fibre cable[2] (OFC) manufacturers and for turnkey service providers for laying down 3G/4G[3] telecom networks. The main customer for the industry were the telecom service providers. Telecom service providers had a market share in India as shown in Exhibit 4. This sector had attracted foreign direct investment (FDI) of approximately US \\( \\$ 17 \\mathrm{bn} \\) in the past 15 years (HFCL, 2015). The foreign investors could now invest up to 100 per cent of the equity capital in this sector (HFCL, 2015). This FDI policy had made the telecom sector a very attractive proposition for foreign investors. Despite considerable progress in the telecom sector, almost 25 per cent of the Indian population had no access to mobile services, especially in remote rural and tribal areas. Geographically, 15 per cent of the country's area had not been covered by mobile services (HFCL, 2015), and broadband penetration was very low in the country. Therefore, large amounts of investments were still needed in telecom infrastructure to cover the whole of India. Government initiatives - Digital India program: This program had been designed to give internet access to all the people in the country by connecting 250,000 villages through the telecom network. The main emphasis of this program was broadband, mobile services and internet access to everybody across the country. The total outlay of this program was Rs 1,130bn (HFCL, 2015). - Smart City program: This program had been launched to make, 100 cities identified from all parts of the country, Smart Cities. One of the main things to make the city Smart was to make the city digital by broadband connectivity, latest mobile services and internet access to all in the city. The total investment for this project was Rs 480bn (HFCL, 2015). - Make in India program: The Government had identified \"Telecom Equipment manufacturing\" as a key focus area under this program. The total telecom equipment market in India excluding handsets was approximately Rs 500bn in the year 2015. Out of this, Indian manufacturers had just 3 per cent market share. If we add the share of foreign companies who were manufacturing in India, the domestic manufacturers' share increased to 15 per cent (HFCL, 2015). These data meant that approximately 85 per cent of the telecom equipment demand was being met through imports from other countries like China, Sweden and the USA. This program was meant to increase the Indian manufacturers' share to 60 per cent in the next five-year period. The projected telecom equipment market excluding mobile and landline handsets was expected to grow to Rs \\( 814.97 \\mathrm{bn} \\) in a span of five years (Exhibit 5). This expected growth meant a CAGR of 10.26 per cent over a period of five years. Future prospects The future growth of the Indian telecom sector would now be in rural areas and laying down a network for 3G/4G telecom services. To achieve 100 per cent connectivity with the rural areas, 150,000 more towers would be required on a pan-India basis. This accomplishment would fulfil the objectives of the Digital India program. The telecom service operators were currently spending approximately Rs 5,600bn on towers and other infrastructure each year (HFCL, 2015). India currently has 130 million 3G-enabled devices, but there were only 69.9 million 3G connections (HFCL, 2015). Similarly, India has 5.5 million 4G-enabled devices, but only 85,000 4G subscribers (HFCL, 2015). These data indicate that there was a big opportunity available to convert the remaining \\( 3 G / 4 G \\) device owners to \\( 3 G / 4 G \\) subscribers by rolling S CASE STUDIES VOL. 7 NO. 32017 out 3G/4G services to other parts of India. Device growth was moving faster than the network growth, which meant that there was a huge opportunity for telecom equipment suppliers and EPC (Execution, Procurement and Commissioning) contractors to grow and capitalize on this market of laying down the telecom network. The OFC market in India would be to the tune of Rs 28bn by the year 2020 (TechSci Research, 2015). The projects such as National Optical Fibre Network, National Fibre Spectrum and the roll-out of 4G telecom services would give a boost to the demand of OFC in India. India currently had an OFC market of around 20 million fibre \\( \\mathrm{km} \\) with a turnover of Rs \\( 10 \\mathrm{bn} \\). The OFC market was expected to grow @ 13 per cent CAGR and reach Rs 15bn by the year 2018 (TechSci Research, 2015). Competitive landscape The telecom equipment manufacturing business in India was being dominated by five foreign players - Ericsson, Nokia-Siemens, Alcatel-Lucent, Huawei and ZTE. There were many small domestic Indian manufacturers too. Few of the domestic players were HFCL, Vindhya Telelinks, D-Link India, Smartlink Network Systems and ADC India Communications. Foreign players were big in size and so they would manufacture telecom equipment almost 30 per cent cheaper than the domestic players because of the economies of scale. Also, there was zero duty on the import of finished telecom equipment, whereas there was 10 to 15 per cent duty on the import of telecom components in India (Gupta, 2014). Chinese manufacturers would obtain long-term loans @ 2 to 3 per cent interest rate from Chinese banks, whereas domestic Indian manufacturers would pay 16 to 18 per cent interest rate for term loans to Indian banks (Gupta, 2014). Because of such low rates of interest being enjoyed by the Chinese companies, they could afford to invest a large amount on R\\&D activities. Also, Chinese banks extended suppliers' credit at concessional terms to the buyers of telecom products from Chinese companies. Indian telecom manufacturers would not get such support from Indian banks. As international players were huge globally and their Indian operations were small when compared to their total world-wide operations, these companies cannot be studied to make any future revenue projections of HFCL. For this purpose, telecom infrastructure companies in India were being taken as a proxy for the turnkey projects segment. The sales revenue of telecom infrastructure companies for the past five years is shown in Exhibit 6. Similarly, for the telecom products segment, the manufacturers of OFC, routers, adapters, switches and telecom fibre accessories were taken as a proxy for telecom products segment. The sales revenue of such companies for the past five years is mentioned in Exhibit 7. Himachal Futuristic Communications Ltd. (HFCL) HFCL started its operations of telecom equipment manufacturing for landline telephony in 1988-1989. It was quite successful in the 1990s and its turnover increased to Rs \\( 1,000 \\mathrm{~m} \\) in 1995 (HFCL, 1995). In 2001, its turnover was Rs 12,942m (HFCL, 2001), but now the landline telephony usage was on a decline. The customers were buying more mobile phones and per cent share of landline phones in the total telecom market started decreasing rapidly. As a result, the turnover of HFCL declined to Rs \\( 4,227 \\mathrm{~m} \\) in \\( F Y \\) 2004-2005 (HFCL, 2005). In FY 2009-2010, the company had a meagre turnover of Rs 3,114m (HFCL, 2010) with reserves completely wiped out, showing nil balance. So the company completely changed its product line and created two business segments: telecom products and turnkey projects. Telecom products The company started producing OFC in its Goa plant. The company had a capacity of 5.4 million fibre km of OFC per annum in FY 2014 (HFCL, 2015), which was fully utilized in FY 2015. The company would increase its capacity of OFC to 9.0 million fibre \\( \\mathrm{km} \\) to take advantage of the huge demand of OFC in future by putting up a plant in Chennai (HFCL, 2015). Exports of OFC would also be stressed upon to leverage great opportunity for the sale of OFC in the international markets. In telecom equipment manufacturing, the company would focus on microwave radios and optical transport equipment, which were being used for laying down GSM networks for 3G/4G services. HFCL had a technical tie-up with DragonWave Inc., a Canadian company for microwave radios. The company had been manufacturing microwave radios and optical transport equipment since 2011-2012. HFCL was able to maintain a superior quality of its products because of technical tie-ups and on-time delivery of its products because of operational efficiency. Turnkey projects The government had emphasized on indigenous procurement for defence and on the modernization of railways. The company would bid for EPC contracts in these two segments vigorously in the future. The company would expect a large number of orders from these two verticals in the future. The two initiatives of the Indian Government, Digital India and Smart Cities, would offer a tremendous opportunity for turnkey projects. The company would want to bid aggressively for EPC contracts under these two initiatives and hope to gain significant revenue from winning such contracts. The company had a strong team to execute EPC contracts, which it would leverage to its maximum potential. HFCL already had the expertise in managing and maintaining the telecom networks at the highest level of efficiency. HFCL had been concentrating its turnkey project operations in a few states where it was already a market leader. Thereby, \\( \\mathrm{HFCL} \\) could manage to lower its cost of execution by negotiating hard with the local contractors owing to its dominant position in that particular state. HFCL had been utilizing telecom products it was manufacturing to execute EPC contracts, which would enable HFCL to complete the project with superior quality within stipulated time given by its customers. Business risks of the company. Although the company had a considerable potential to grow in terms of revenues and profits, it was exposed to some risks. First, there was stiff competition from international players and small domestic players in the tender-based business[4]. Second, the equipment suppliers ran the risk of delay in completion of orders which would attract huge penalties. Third, foreign companies might tie-up with other indigenous equipment suppliers or set-up their own manufacturing facilities in India (HFCL, 2015). HFCL stock - valuing high growth company HFCL became a high growth company because of its completely different business model since FY 2011-2012. Revenue grew from FY 2011-2012 to FY 2014-2015 at CAGR of 114 per cent. Typically, high growth companies are those whose organic revenue growth exceeds 20 per cent annually. For a high growth company, historical financial results would provide limited insight about future prospects of the company. Therefore, to value a high growth company, one would begin by estimating the size of the potential market, predict the level of sustainable profitability and estimate the investments necessary to achieve targeted sales. Then after \\begin{tabular}{l|l} ISE STUDIES & VOL. 7 NO. 32017 \\end{tabular} developing a long-term future view, work backward to connect the future to current performance. Given the level of uncertainty, one would develop multiple scenarios based on estimated revenues, returns generated on newly invested capital (RONIC) and the long-term growth rate. Choudhary had analysed the industry by collecting the revenue data (Exhibits 6 and 7) for the main companies within the industry. He then developed three scenarios based on the revenue growth projections and RONIC for the company. Choudhary had already collected the past income statement (Exhibit 8) and the past balance sheet (Exhibit 9) about the company. The segment-wise revenues, operating profits and capital employed are shown in Exhibit 10. He had estimated the Beta[5] for the company to be 1.30 for one year and the average market risk premium[6] as 5 per cent for India. The 10-year government securities benchmark yield[7] as on 31 March 2015 was 7.66 per cent p.a. Choudhary projected the income statement based on the ratios of operating expenses to revenue for the year FY 2014-2015. Raw material consumed was taken based on revenue from telecom products and outsourced manufacturing jobs was taken based on revenue from turnkey projects, in FY 2014-2015. The depreciation was calculated as per cent of net fixed assets in line with FY 2014-2015. Interest expense was calculated at 10 per cent incremental cost of debt. The income tax expense was calculated at the marginal corporate tax rate of 30 per cent. The cumulative redeemable preference shares[8] carried a dividend rate of 6.5 per cent p.a. and would be redeemed at the rate of 25 and 75 per cent in FY 2017-2018 and FY 2018-2019, respectively. The equity dividend pay-out could be taken based on a reasonable assumption depending on the specific scenario. Choudhary projected the working capital requirement based on customer's collection period days, inventory holding period days and supplier's credit days as in FY 2014-2015. Advances to vendors were calculated as per cent of revenues in line with FY 2014-2015. Deposits from customers were estimated as per cent of turnkey project revenues in line with FY 2014-2015. Choudhary projected the net fixed assets as per cent of revenues in line with FY 2014-2015. The debt was estimated based on debt to EBIDTA (Earnings before Interest, Depreciation, Taxes and Amortization) ratio of FY 2014-2015. Continuing value Choudhary now turned his attention to ascertain the continuing value of the company, which would be a major component in the total value of the company. He decided to estimate the continuing value (CV; Koller et al., 2015) using the value driver formula: \\[ \\mathrm{CV}=\\operatorname{NOPLAT}_{\\mathrm{t}+1}(1-\\mathrm{g} / \\mathrm{RONIC}) /(\\mathrm{WACC}-\\mathrm{g}) \\] NOPLAT \\( _{\\mathrm{t}+1}= \\) net operating profit less adjusted taxes in the first year after the explicit forecast period; g \\( \\quad= \\) expected growth rate in NOPLAT in perpetuity; RONIC = expected rate of return on new invested capital; and WACC \\( = \\) weighted average cost of capital. The RONIC would be ascertained based on three scenarios. The RONIC would differ across three scenarios based on the competitive structure of the industry and whether the company would be able to retain its competitive advantage vis--vis its rivals in the long run. Theoretically, long-term growth rate \\( (\\mathrm{g} \\) ) for the company would be a product of return on invested capital (ROIC) and its reinvestment rate (IR). However, g would be constrained by the growth in the product market in which the company operates, in the long run. Therefore, \\begin{tabular}{l|l} VOL. 7 NO. 32017 & EMERALD EMERC \\\\ \\end{tabular} \\( g \\) would be lower of the theoretical value or the constraint for each scenario. It was assumed that HFCL would continue to operate in the same product category and the same product market (that is India) in the long term. Choudhary, with all the knowledge at his disposal, started to value this high growth company using a scenario-based discounted cash flow (DCF) valuation technique. He would develop three scenarios to capture the uncertainty associated with a high growth company. He would then estimate enterprise value and implied equity value for each of the scenarios based on the DCF technique. Choudhary would also estimate the probability of occurrence for each scenario based on the historical performance of other high growth companies. Ultimately, he would calculate the probability-weighted expected value of the share. He wondered whether the intrinsic value of the share so calculated would be below or above the market price of the stock as on 31 March 2015. Ultimately, that would decide his recommendation to the clients. Notes 1. FY (Financial Year): It is a period of one year for which the financial statements are prepared. It typically starts from April 1 of each year and ends at March 31 of the following year. For example, FY 2009-2010 will typically start on 1 April 2009, and end on 31 March 2010. 2. Optical fibre cable: Optical fibre cable contains one or more optical fibres that are used to carry light. The data can be transmitted at a very high speed through refraction of light. 3. 3G and 4G: 3G technology is the third-generation mobile technology that is used to transfer data other than voice signals. 4G technology is the fourth-generation technology, which is faster and more advanced than 3G. 4G technology enables the use of video calls and mobile TV. 4G uses more bandwidth than 3G. 4. Tender-based business: The buying organization floats a tender to invite all potential suppliers to bid for a contract to supply certain good or services. The contract is normally awarded to the supplier who quoted the lowest price, all other things being equal vis--vis other suppliers. 5. \"Himachal Futuristic Communications Ltd.\" HMFC.NS. Accessed 3 March 2016, Thomson Reuters database. 6. The Market Risk Premium has been taken from the perspective of a Global Investor. India has become increasingly integrated with the global capital markets because of foreign institutional investors (FIIs) investing billions of US dollars in the Indian equity market. As country risk are diversifiable from the perspective of a global investor, we need no additional country risk premium for India, other than the global estimate of market risk premium. The global estimate of average market risk premium is 5 per cent [This whole assertion is mentioned in the Book referred to in the Teaching Note \"Suggested Readings\" (a)]. So, Market Risk Premium of 5 per cent has been assumed in the case, for the sake of simplicity. 7. \"10-year G-Sec Benchmark yield\". INR10HYZ=TCCL-Bid. Accessed 3 March 2016. Thomson Reuters database. 8. Originally, the Cumulative Redeemable Preference Shares (CRPS) were issued at the coupon rate of 12 per cent p.a. for Rs 805m in FY 2003-2004. Subsequently, the company went for Corporate Debt Restructuring (CDR) in January 2011. As per the rework package of the CDR, the CRPS would carry a coupon rate of 6.5 per cent p.a. from the CDR cut-off date of 1 January 2011. 9. CAGR: Compound annual growth rate Keywords: Financial analysis/ forecasting, Financial investment/ markets, Financial modelling/ forecasting 10. This finding has been taken from \"Source: Koller et al. (2010)\". I have assumed this for the sake of simplicity, as focus of the case is to illustrate the methodology of valuing a high growth company. 11. HFCL would hit constant growth phase in five years' time because it belongs to Indian telecom equipment industry. This industry would mature in next five years' time because most of the optical fibre network, telecom towers, base transceiver stations (BTS) and telecom infrastructure would be in place throughout the country in the next five years' time. So, for the sake of simplicity, the explicit forecast period has been taken as five years. PAGE 6 | EMERALD EMERGING MARKETS CASE STUDIES | VOL. 7 NO. 32017 References Corporate Catalyst (India) Pvt. Ltd. (January 2015), \"Telecom sector in India\", available at: www.asa. in/file-download? . . \\%2FUpload\\%2FfldInsights\\%2FTTelecom-Sector-in-India (accessed 17 February 2016). Gupta, S.D. (2014), \"Over 90\\% of telecom gear in India's Rs. 50,000-Cr market is imported\", Business Standard, 29 April, available at: www.business-standard.com/article/companies/over-90-of-telecom-gearin-india-s-rs-50-000-cr-market-is-imported-114042900254_1.html (accessed 17 February). HFCL (1995), Annual Report 1994-95, HFCL. HFCL (2001), Annual Report 2000-01, HFCL. HFCL (2005), Annual Report 2004-05, HFCL. HFCL (2010), Annual Report 2009-10, HFCL. HFCL (2015), Annual Report 2014-15, Management Discussion and Analysis, pp. 16-26, available at: www.hfcl.com/investors\\#annual_reports (accessed 11 Match 2016). Koller, T., Goedhart, M. and Wessels, D. (2010), \"Chapter 4: return on invested capital\", Valuation: Measuring and Managing the Value of Companies, 5th ed., McKinsey \\& Company/Wiley, p. 74. Koller, T., Goedhart, M. and Wessels, D. (2015), \"Estimating continuing value\", in Koller, T., Goedhart, M. and Wessels, D. (Eds), Valuation, John Wiley \\& Sons, NJ, pp. 260-261. TechSci Research (2015), \"Indian optical fibre cables (OFC) market to reach USD424 million by 2020\", available at: www.techsciresearch.comews/298-india-optical-fiber-cables-ofc-market-to-reach-usd4 24-million-by-2020.html (accessed 17 February 2016). Exhibit 1. HFCL equity share closing price (in Rs) \\begin{tabular}{l|l|l} VOL. 7 NO. 32017 & EMERALD EMERGING MARKETS CASE STUDIES & PAGE 7 \\end{tabular} Exhibit 2. Number of internet subscribers in India Exhibit 3. Number of broadband subscribers in India PAGE 8 | EMERALD EMERGING MARKETS CASE STUDIES | VOL. 7 NO. 32017 Exhibit 4. Market share of telecom service providers in India Figure E4 Exhibit 6. Sales revenue - telecom infrastructure companies \\begin{tabular}{l|l|l} VOL. 7 NO. 32017 & EMERALD EMERGING MARKETS CASE STUDIES & PAGE 9 \\end{tabular} Exhibit 7. Sales revenue - telecom product companies Exhibit 8 \\begin{tabular}{l|l|l} PAGE 10 & EMERALD EMERGING MARKETS CASE STUDIES & VOL. 7 NO. 32017 \\end{tabular} Exhibit 9 Exhibit 10 Corresponding author Alok Kastia can be contacted at: akastia@gmail.com VOL. 7 NO. 32017 EMERALD EMERGING MARKETS CASE STUDIES \\( \\mid \\) PAGE 11
 Step by Step Solution
There are 3 Steps involved in it
Step: 1

Get Instant Access to Expert-Tailored Solutions
See step-by-step solutions with expert insights and AI powered tools for academic success
Step: 2

Step: 3
Ace Your Homework with AI
Get the answers you need in no time with our AI-driven, step-by-step assistance
Get Started
Financial Modeling Using Excel And VBA
Authors: Chandan Sengupta
1st Edition
0471267686, 978-0471267683