

Answered step by step
Verified Expert Solution
Question
1 Approved Answer
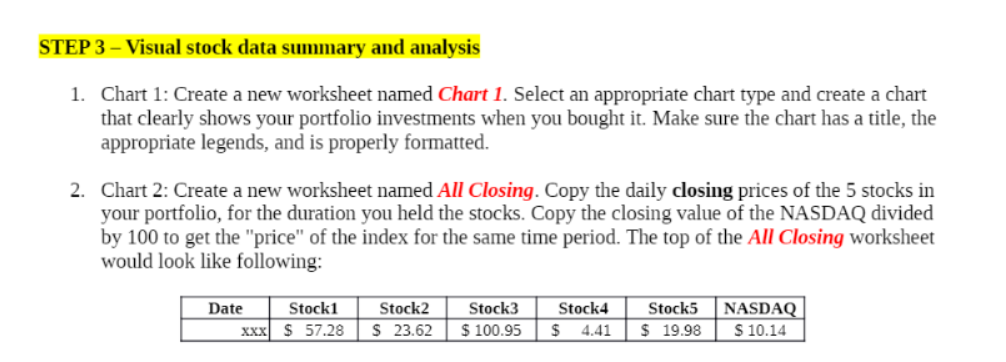
hHow do I know which 5 stocks this question refers to? STEP 3 - Visual stock data summary and analysis 1. Chart 1: Create a
 hHow do I know which 5 stocks this question refers to?
Step by Step Solution
There are 3 Steps involved in it
Step: 1

Get Instant Access to Expert-Tailored Solutions
See step-by-step solutions with expert insights and AI powered tools for academic success
Step: 2

Step: 3
Ace Your Homework with AI
Get the answers you need in no time with our AI-driven, step-by-step assistance
Get Started
Real Estate Finance
Authors: John P. Wiedemer, Keith J. Baker
9th edition
324181426, 324181425, 978-0324181425