

Question: Hi can anyone please help me with this excersise? b) compare the results with 7.5 in the textbook Applied Digital Signal Processing. Dimitris G. Manolakis,
Hi can anyone please help me with this excersise?
b) compare the results with 7.5 in the textbook Applied Digital Signal Processing. Dimitris G. Manolakis, Vinay K. Ingle
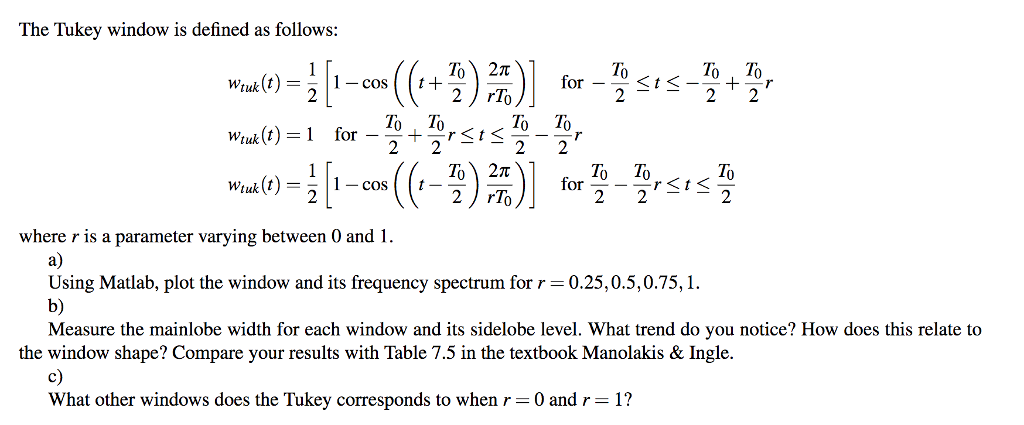
The Tukey window is defined as follows: 10 for 2 rTo To To To To To To To wruk (t) = 1 - cos t 2) rlo where r 1s a parameter varying between 0 and I. a) Using Matlab, plot the window and its frequency spectrum for r- 0.25,0.5,0.75,1. b) Measure the mainlobe width for each window and its sidelobe level. What trend do you notice? How does this relate to the window shape? Compare your results with Table 7.5 in the textbook Manolakis & Ingle. c) What other windows does the Tukey corresponds to when r-0 and r-1? The Tukey window is defined as follows: 10 for 2 rTo To To To To To To To wruk (t) = 1 - cos t 2) rlo where r 1s a parameter varying between 0 and I. a) Using Matlab, plot the window and its frequency spectrum for r- 0.25,0.5,0.75,1. b) Measure the mainlobe width for each window and its sidelobe level. What trend do you notice? How does this relate to the window shape? Compare your results with Table 7.5 in the textbook Manolakis & Ingle. c) What other windows does the Tukey corresponds to when r-0 and r-1
Step by Step Solution
There are 3 Steps involved in it

Get step-by-step solutions from verified subject matter experts