Answered step by step
Verified Expert Solution
Question
1 Approved Answer
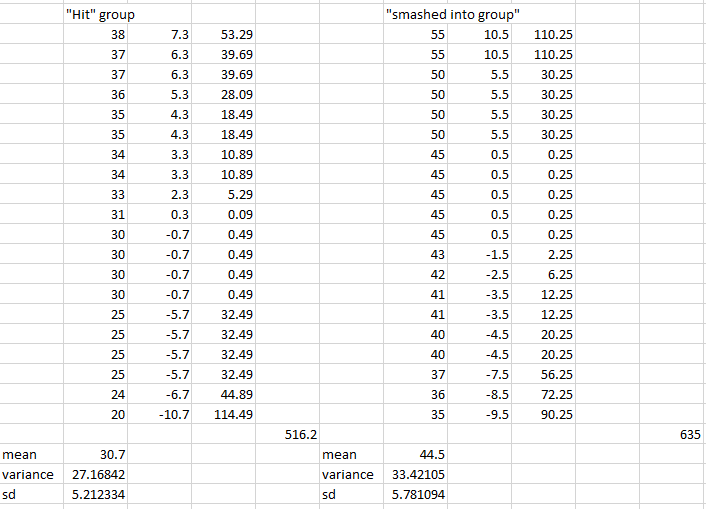
Hi can you help me with the following questions for the data below? LOOK AT PICTURE ATTACHED 1) Can you show me how to calculate
Hi can you help me with the following questions for the data below? LOOK AT PICTURE ATTACHED
1) Can you show me how to calculate risk level?
2) What is the best statistical test to use - z-test? correlation test? t-test for dependent or independent levels?
3) I need help finding the degrees of freedom. Can you show me how to approach this?
DATA :
"Hit" group
38 37 37 36 35 35 34 34 33 31 30 30 30 30 25 25 25 25 24 20
Mean:
SD:
"smashed into" group
55 55 50 50 50 50 45 45 45 45 45 43 42 41 41 40 40 37 36 35
Mean:
SD:

Step by Step Solution
There are 3 Steps involved in it
Step: 1

Get Instant Access to Expert-Tailored Solutions
See step-by-step solutions with expert insights and AI powered tools for academic success
Step: 2

Step: 3

Ace Your Homework with AI
Get the answers you need in no time with our AI-driven, step-by-step assistance
Get Started


