

Answered step by step
Verified Expert Solution
Question
1 Approved Answer
Hi, can you solve Question 7 with code? Thanks. Burrito-ful San Diego Tam, Margaret and Winifred are trying to use Data Science to find the
Hi, can you solve Question 7 with code? Thanks.
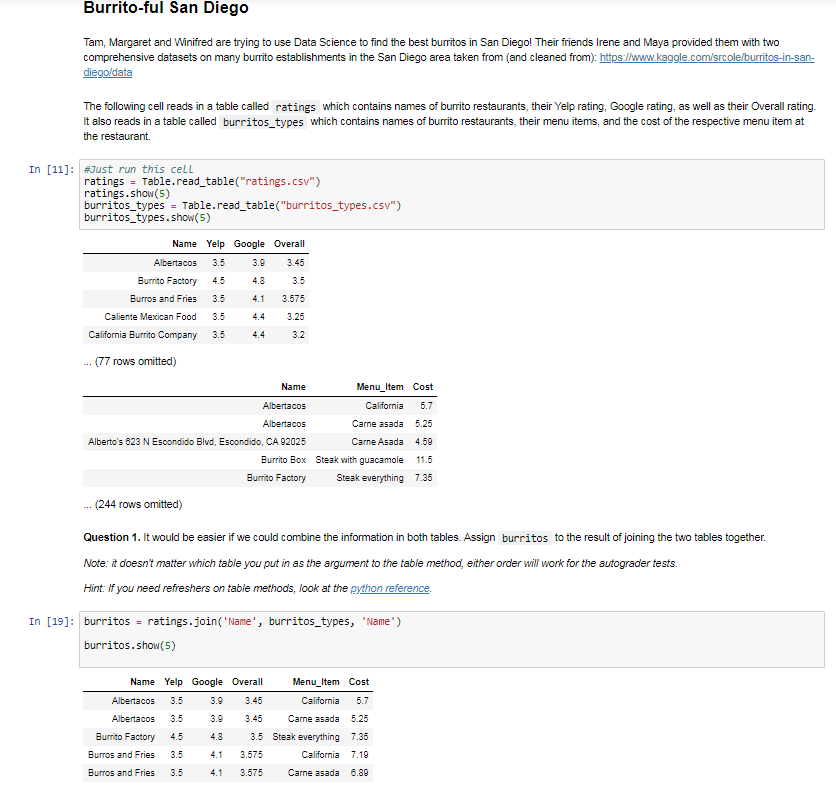
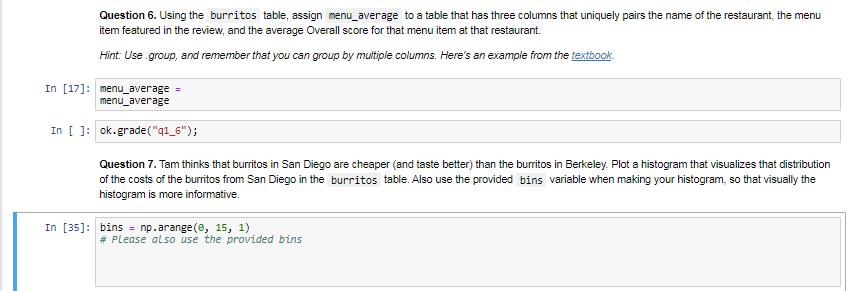
Burrito-ful San Diego Tam, Margaret and Winifred are trying to use Data Science to find the best burritos in San Diego! Their friends Irene and Maya provided them with two comprehensive datasets on many burrito establishments in the San Diego area taken from (and cleaned from): https://www.kaggle.com/srcole/burritos-in-san- diego/data The following cell reads in a table called ratings which contains names of burrito restaurants, their Yelp rating, Google rating, as well as their Overall rating. It also reads in a table called burritos_types which contains names of burrito restaurants, their menu items, and the cost of the respective menu item at the restaurant In [11]: #Just run this cell ratings = Table.read_table("ratings.csv") ratings.show(5) burritos_types = Table.read_table("burritos_types.csv") burritos_types.show(5) Name Yelp Google Overall Albertacos 3.5 3.9 3.45 Burrito Factory 4.5 4.8 3.5 Burros and Fries 3.5 4.1 3.575 Caliente Mexican Food 3.5 4.4 3.25 California Burrito Company 3.5 4.4 3.2 ... (77 rows omitted) Name Albertacos Albertacos Alberto's 623 N Escondido Blvd, Escondido, CA 92025 Burrito Box Burrito Factory Menu_Item Cost California 5.7 Carne asada 5.25 Carne Asada 4.59 Steak with guacamole 11.5 Steak everything 7.35 ... (244 rows omitted) Question 1. It would be easier if we could combine the information in both tables. Assign burritos to the result of joining the two tables together. Note: it doesn't matter which table you put in as the argument to the table method, either order will work for the autograder tests. Hint: If you need refreshers on table methods, look at the python reference, In [19]: burritos = ratings.join('Name', burritos_types, 'Name') burritos.show(5) Name Yelp Google Overall Albertacos 3.5 3.9 3.45 Albertacos 3.5 3.9 3.45 Burrito Factory 4.5 4.3 3.5 Burros and Fries 3.5 4.1 3.575 Burros and Fries 3.5 4.1 3.575 Menu_Item Cost California 5.7 Carne asada 5.25 Steak everything 7.35 California 7.19 Carne asada 6.89 Question 6. Using the burritos table, assign menu_average to a table that has three columns that uniquely pairs the name of the restaurant, the menu item featured in the review, and the average Overall score for that menu item at that restaurant. Hint: Use group, and remember that you can group by multiple columns. Here's an example from the textbook. In [17]: menu_average = menu_average In [ ]: ok.grade("q1_6"); Question 7. Tam thinks that burritos in San Diego are cheaper (and taste better) than the burritos in Berkeley. Plot a histogram that visualizes that distribution of the costs of the burritos from San Diego in the burritos table. Also use the provided bins variable when making your histogram, so that visually the histogram is more informative. In [35]: bins = np.arange(0, 15, 1) # Please also use the provided binsStep by Step Solution
There are 3 Steps involved in it
Step: 1

Get Instant Access to Expert-Tailored Solutions
See step-by-step solutions with expert insights and AI powered tools for academic success
Step: 2

Step: 3
Ace Your Homework with AI
Get the answers you need in no time with our AI-driven, step-by-step assistance
Get Started
Database Design And Implementation
Authors: Edward Sciore
2nd Edition
3030338355, 978-3030338350