Answered step by step
Verified Expert Solution
Link Copied!

Question

1 Approved Answer

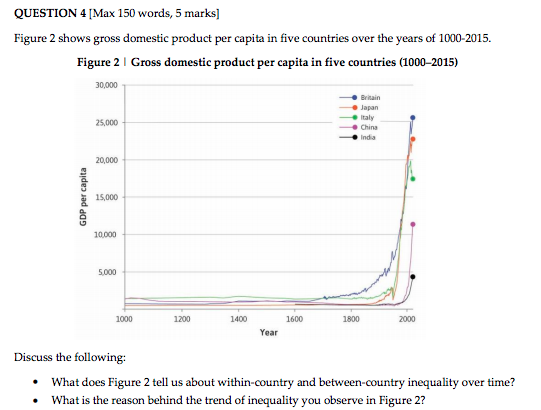
Hi, could i please have help with this question QUESTION 4 [ Max 150 words, 5 marks] Figure 2 shows gross domestic product per capita

Hi, could i please have help with this question

image text in transcribed
QUESTION 4 [ Max 150 words, 5 marks] Figure 2 shows gross domestic product per capita in five countries over the years of 1000-2015. Figure 2 | Gross domestic product per capita in five countries (1000-2015) 30,000 Britain Japan 25,000 Italy China India 20,000 GDP per capita 15,000 10.000 5.000 1000 1200 1400 1600 1800 2000 Year Discuss the following: . What does Figure 2 tell us about within-country and between-country inequality over time? What is the reason behind the trend of inequality you observe in Figure 2

Step by Step Solution

There are 3 Steps involved in it

Step: 1

blur-text-image

Get Instant Access to Expert-Tailored Solutions

See step-by-step solutions with expert insights and AI powered tools for academic success

Step: 2

blur-text-image

Step: 3

blur-text-image

Ace Your Homework with AI

Get the answers you need in no time with our AI-driven, step-by-step assistance

Get Started

Recommended Textbook for

International Economics Theory and Policy

Authors: Paul R. Krugman, Maurice Obstfeld, Marc J. Melitz

9th Edition

978-0132146654, 0132146657, 9780273754091, 978-0273754206

More Books

Students also viewed these Economics questions

Question

What is computer neworking ?

Answered: 1 week ago

Question

LO3.2 Describe demand and explain how it can change.

Answered: 1 week ago