

Answered step by step
Verified Expert Solution
Question
1 Approved Answer
hi could you please help me solve step 5 & 6 . the first picture is for step 1,2,3,&4 now i nedd help with step
hi could you please help me solve step 5 & 6 . the first picture is for step 1,2,3,&4 now i nedd help with step 5 & 6 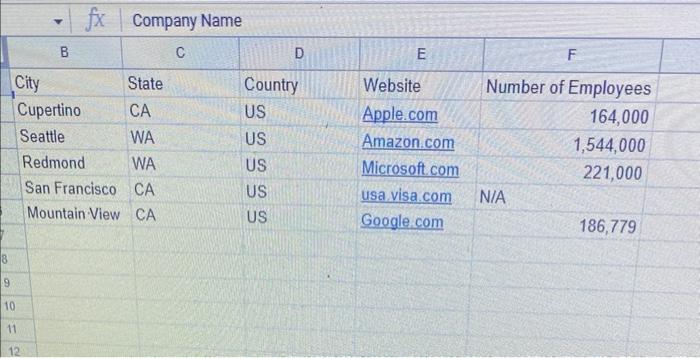
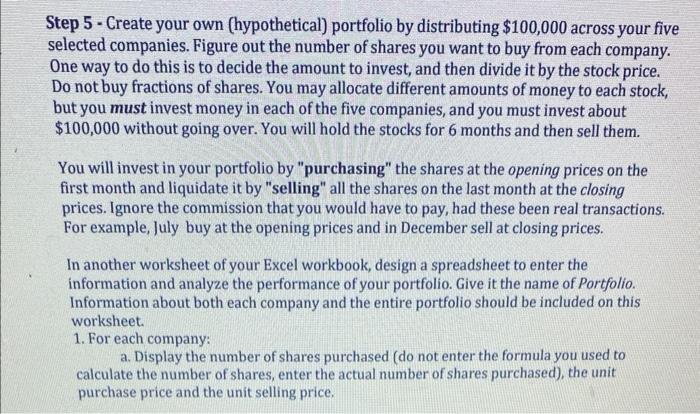
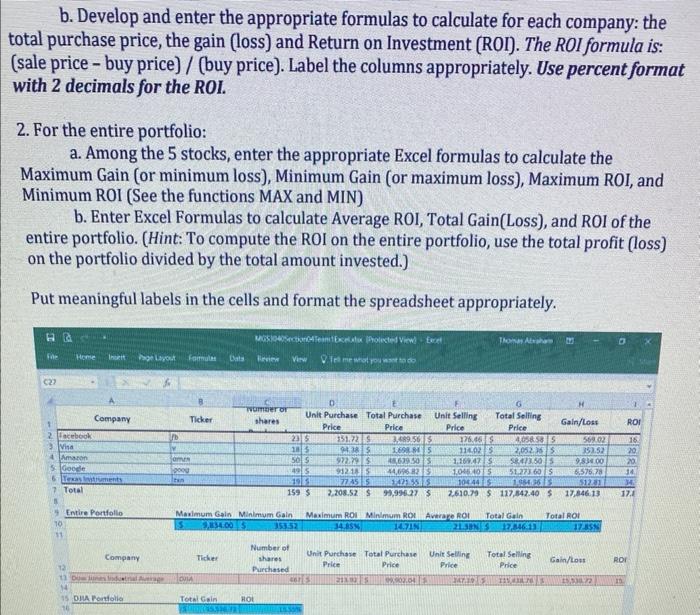
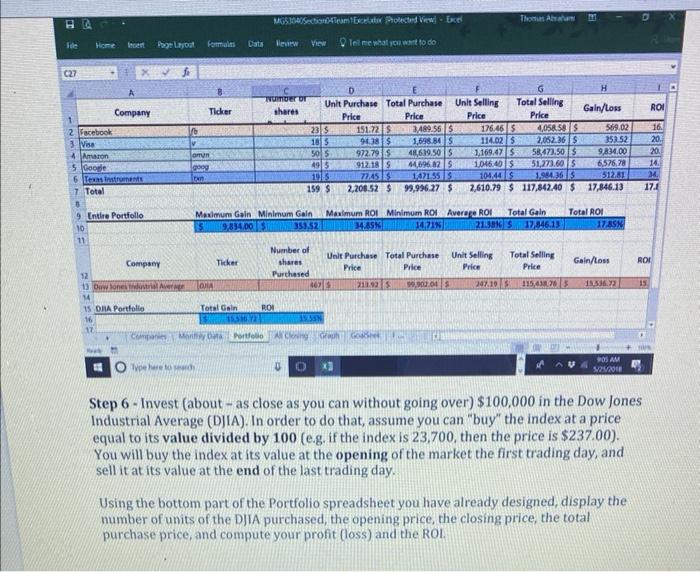
Step 5 - Create your own (hypothetical) portfolio by distributing $100,000 across your five selected companies. Figure out the number of shares you want to buy from each company. One way to do this is to decide the amount to invest, and then divide it by the stock price. Do not buy fractions of shares. You may allocate different amounts of money to each stock, but you must invest money in each of the five companies, and you must invest about $100,000 without going over. You will hold the stocks for 6 months and then sell them. You will invest in your portfolio by "purchasing" the shares at the opening prices on the first month and liquidate it by "selling" all the shares on the last month at the closing prices. Ignore the commission that you would have to pay, had these been real transactions. For example, July buy at the opening prices and in December sell at closing prices. In another worksheet of your Excel workbook, design a spreadsheet to enter the information and analyze the performance of your portfolio. Give it the name of Portfolio. Information about both each company and the entire portfolio should be included on this worksheet. 1. For each company: a. Display the number of shares purchased (do not enter the formula you used to calculate the number of shares, enter the actual number of shares purchased), the unit purchase price and the unit selling price. b. Develop and enter the appropriate formulas to calculate for each company: the total purchase price, the gain (loss) and Return on Investment (ROI). The ROI formula is: (sale price - buy price) / (buy price). Label the columns appropriately. Use percent format with 2 decimals for the ROI. 2. For the entire portfolio: a. Among the 5 stocks, enter the appropriate Excel formulas to calculate the Maximum Gain (or minimum loss), Minimum Gain (or maximum loss), Maximum ROI, and Minimum ROI (See the functions MAX and MIN) b. Enter Excel Formulas to calculate Average R0I, Total Gain(Loss), and ROI of the entire portfolio. (Hint: To compute the ROI on the entire portfolio, use the total profit (loss) on the portfolio divided by the total amount invested.) Put meaningful labels in the cells and format the spreadsheet appropriately. Step 6 - Invest (about - as close as you can without going over) $100,000 in the Dow Jones Industrial Average (DJIA). In order to do that, assume you can "buy" the index at a price equal to its value divided by 100 (e.g. if the index is 23,700, then the price is $237.00 ). You will buy the index at its value at the opening of the market the first trading day, and sell it at its value at the end of the last trading day. Using the bottom part of the Portfolio spreadsheet you have already designed, display the number of units of the DJIA purchased, the opening price, the closing price, the total purchase price, and compute your profit (loss) and the ROL Step by Step Solution
There are 3 Steps involved in it
Step: 1

Get Instant Access to Expert-Tailored Solutions
See step-by-step solutions with expert insights and AI powered tools for academic success
Step: 2

Step: 3
Ace Your Homework with AI
Get the answers you need in no time with our AI-driven, step-by-step assistance
Get Started
Finance For Freelancers Financial Intelligence
Authors: Andrew Holmes
1st Edition
1408101165, 978-1408101162