

Answered step by step
Verified Expert Solution
Question
1 Approved Answer
Hi, i do not know how to explain the Sales and EBIT in horizontal analysis? Telstra Group Year ended 30 June 2018 2017 Note I
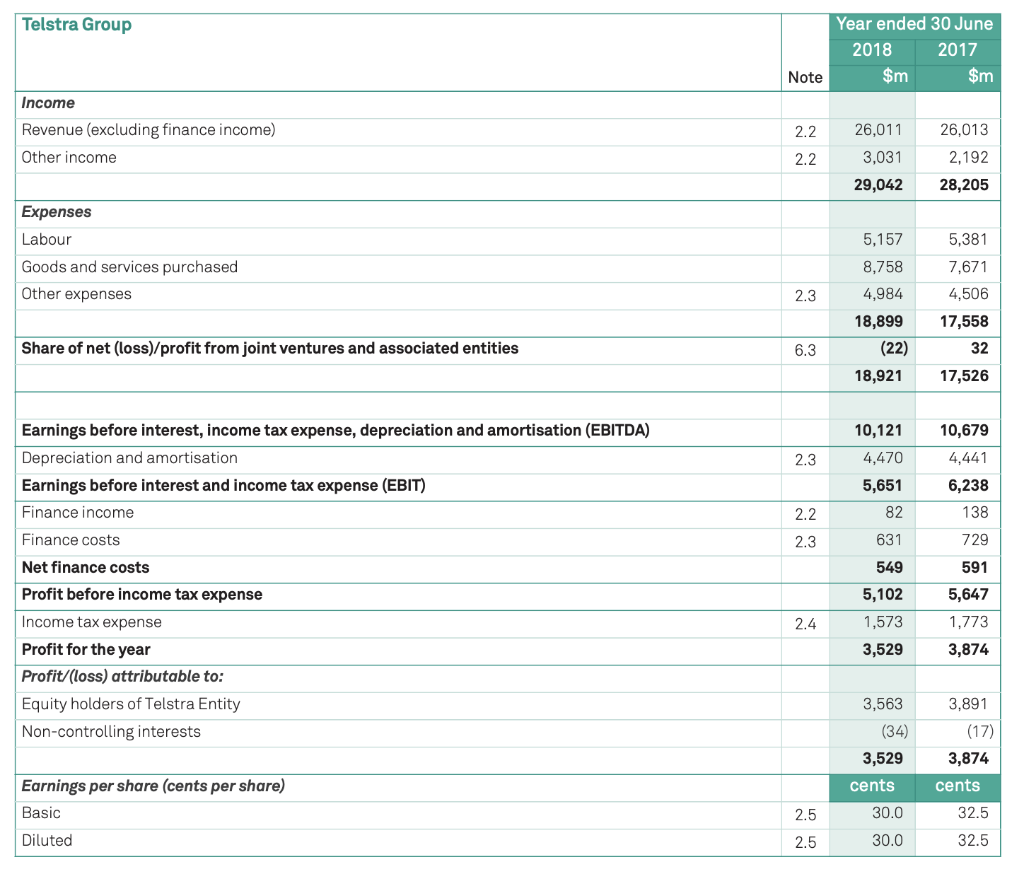
Hi, i do not know how to explain the Sales and EBIT in horizontal analysis?
Telstra Group Year ended 30 June 2018 2017 Note I $m $m Income Revenue (excluding finance income) Other income 2.2 2.2 26,011 3,031 29,042 26,013 2,192 28,205 Expenses Labour Goods and services purchased Other expenses 5,157 8,758 4,984 18,899 (22) 18,921 5,381 7,671 4,506 17,558 2.3 Share of net (loss)/profit from joint ventures and associated entities 6.3 17,526 10,121 4,470 5,651 82 2.2 2.3 631 Earnings before interest, income tax expense, depreciation and amortisation (EBITDA) Depreciation and amortisation Earnings before interest and income tax expense (EBIT) Finance income Finance costs Net finance costs Profit before income tax expense Income tax expense Profit for the year Profit/(loss) attributable to: Equity holders of Telstra Entity Non-controlling interests 10,679 4,441 6,238 138 729 591 5,647 1,773 3,874 549 5,102 1,573 3,529 2.4 3,891 (17) 3,874 3,563 (34) 3,529 cents 30.0 30.0 Earnings per share (cents per share) Basic Diluted 2.5 2.5 cents 32.5 32.5Step by Step Solution
There are 3 Steps involved in it
Step: 1

Get Instant Access to Expert-Tailored Solutions
See step-by-step solutions with expert insights and AI powered tools for academic success
Step: 2

Step: 3
Ace Your Homework with AI
Get the answers you need in no time with our AI-driven, step-by-step assistance
Get Started
Introduction To Managerial Accounting
Authors: Peter C. Brewer
Custom Edition
0077842987, 978-0077842987