Answered step by step
Verified Expert Solution
Link Copied!

Question

1 Approved Answer

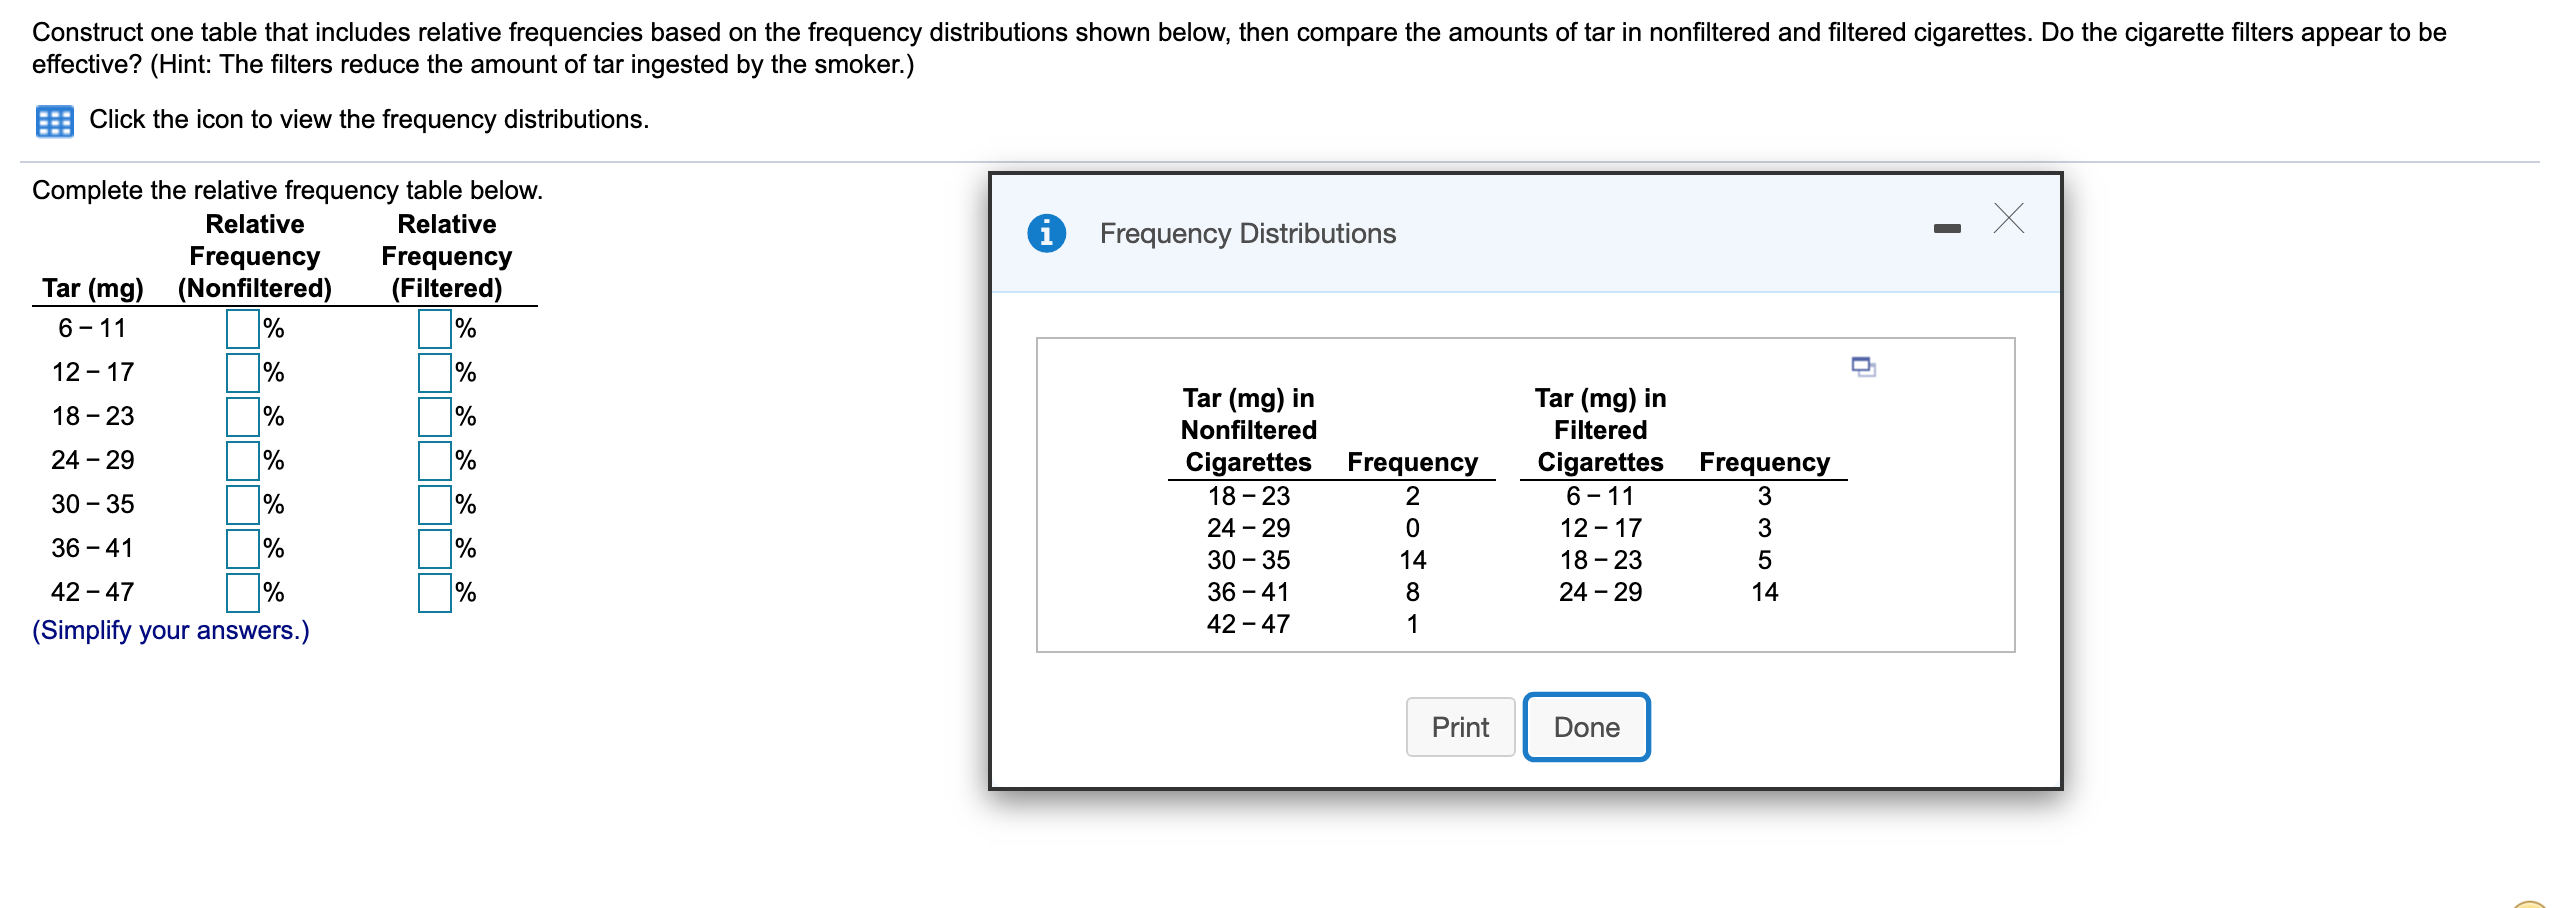
Hi, I need help in solving this problem. I don't understand how to set up and solve. Construct one table that includes relative frequencies based

Hi, I need help in solving this problem. I don't understand how to set up and solve.

image text in transcribed
Construct one table that includes relative frequencies based on the frequency distributions shown below, then compare the amounts of tar in nonfiltered and filtered cigarettes. Do the cigarette filters appear to be effective? (Hint: The filters reduce the amount of tar ingested by the smoker.) Click the icon to view the frequency distributions. Complete the relative frequency table below. Relative Relative i Frequency Distributions - X Frequency Frequency Tar (mg) (Nonfiltered) (Filtered) 6 -11 12- 17 % 18 -23 % % Tar (mg) in Tar (mg) in Nonfiltered Filtered 24 - 29 % Cigarettes Frequency Cigarettes Frequency 30 - 35 18 -23 24 -29 36 -41 30 -35 ON 6 - 11 12-17 14 18 -23 42 -47 36 - 41 24-29 (Simplify your answers.) 42 -47 - Print Done

Step by Step Solution

There are 3 Steps involved in it

Step: 1

blur-text-image

Get Instant Access to Expert-Tailored Solutions

See step-by-step solutions with expert insights and AI powered tools for academic success

Step: 2

blur-text-image

Step: 3

blur-text-image

Ace Your Homework with AI

Get the answers you need in no time with our AI-driven, step-by-step assistance

Get Started

Recommended Textbook for

Algebra 2

Authors: Edward B. Burger, Juli K. Dixon, Steven J. Leinwand, Timothy D. Kanold

1st Edition

0544385918, 978-0544385917

More Books

Students also viewed these Mathematics questions

Question

Discuss the planning steps in a simple capital needs analysis?

Answered: 1 week ago