Answered step by step
Verified Expert Solution
Question
1 Approved Answer
Hi I need help with this python work (original please)ASAP. Thanks so much! print_error_strings.txthttps://www.cse.msu.edu/~cse231/Projects/Project04/print_error_strings.txt proj04.pyhttps://www.cse.msu.edu/~cse231/Projects/Project04/proj04.py year2014.txthttps://www.cse.msu.edu/~cse231/Projects/Project04/year2014.txt year2015.txthttps://www.cse.msu.edu/~cse231/Projects/Project04/year2015.txt http://www.cse.msu.edu/~cse231/Online/Projects/Project04/ Assignment overview This assignment focuses on the
Hi I need help with this python work (original please)ASAP. Thanks so much!
 print_error_strings.txthttps://www.cse.msu.edu/~cse231/Projects/Project04/print_error_strings.txt
proj04.pyhttps://www.cse.msu.edu/~cse231/Projects/Project04/proj04.py
year2014.txthttps://www.cse.msu.edu/~cse231/Projects/Project04/year2014.txt
year2015.txthttps://www.cse.msu.edu/~cse231/Projects/Project04/year2015.txt
http://www.cse.msu.edu/~cse231/Online/Projects/Project04/
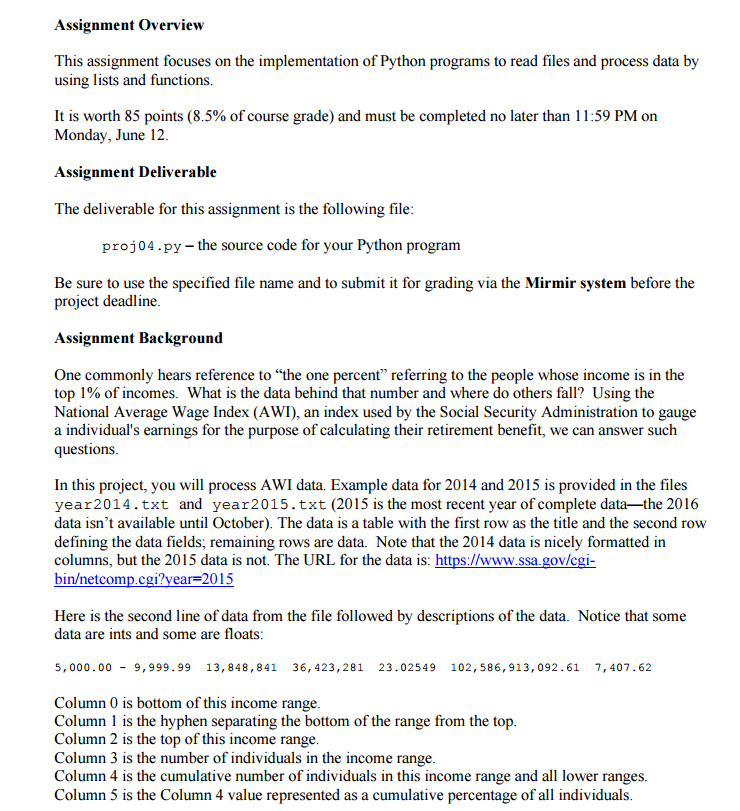
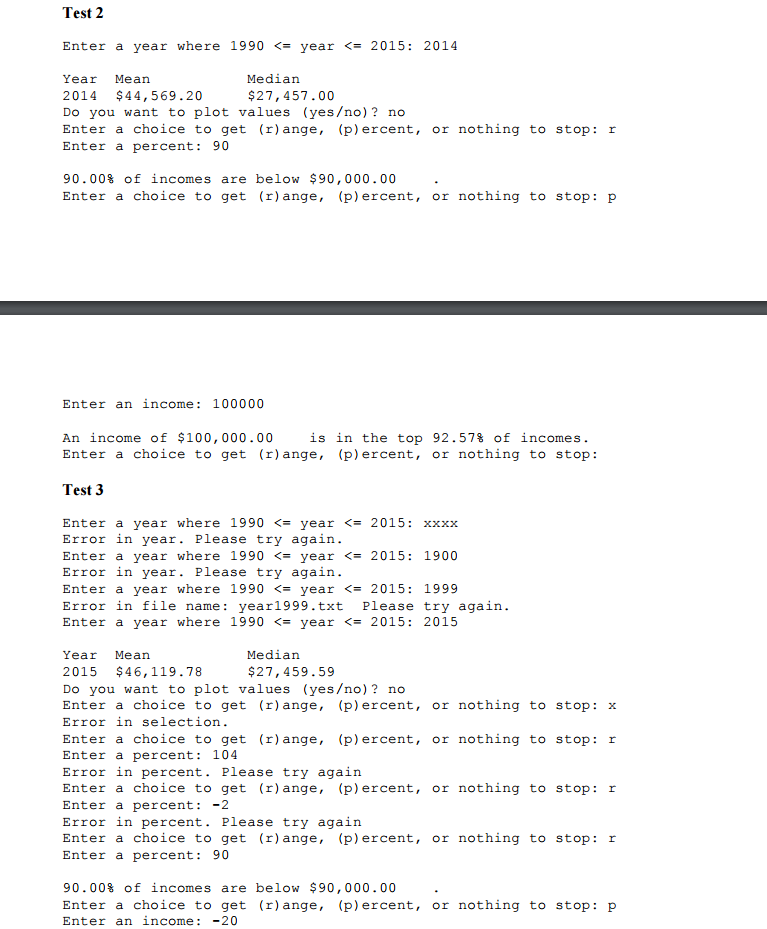
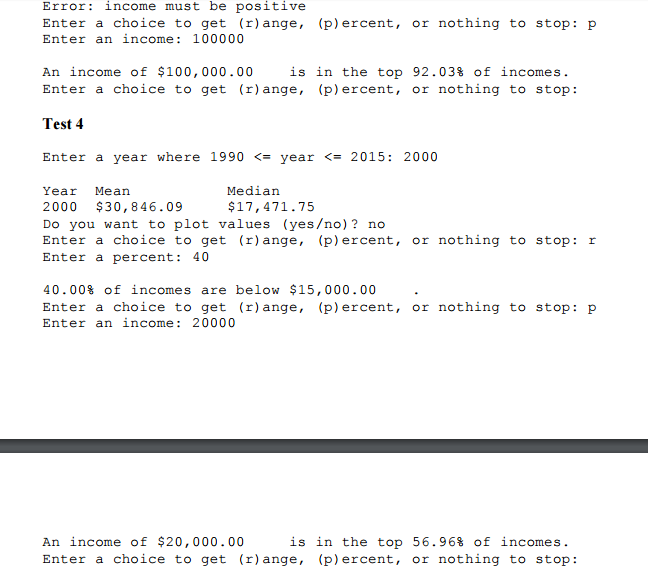
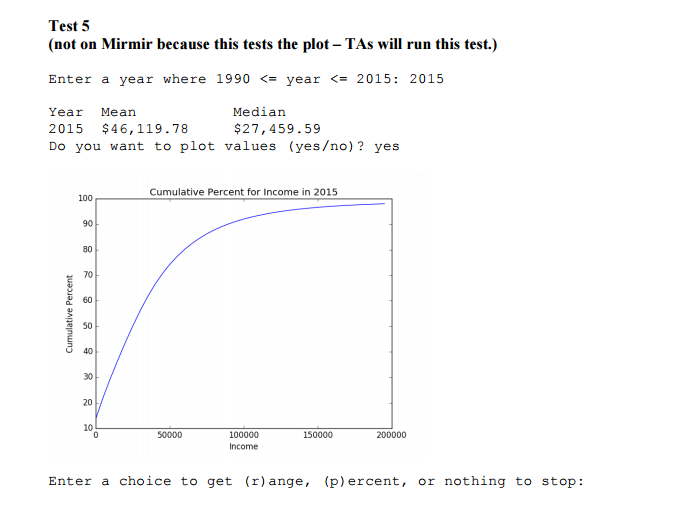
Assignment overview This assignment focuses on the implementation of Python programs to read files and process data by using lists and functions It is worth 85 points (8.5% of course grade) and must be completed no later than 11:59 PM on Monday, June 12 Assignment Deliverable The deliverable for this assignment is the following file proj04.py the source code for your Python program Be sure to use the specified file name and to submit it for grading via the Mirmir system before the project deadline Assignment Background One commonly hears reference to "the one percent" referring to the people whose income is in the top 1% of incomes. What is the data behind that number and where do others fall? Using the National Average Wage Index (AWI), an index used by the Social Security Administration to gauge a individual's earnings for the purpose of calculating their retirement benefit, we can answer such questions In this project, you will process AWI data. Example data for 2014 and 2015 is provided in the files year 2014. txt and year 2015. txt (2015 is the most recent year of complete data-the 2016 data isn't available until October). The data is a table with the first row as the title and the second row defining the data fields, remaining rows are data. Note that the 2014 data is nicely formatted in columns, but the 2015 data is not. The URL for the data is: https://www.ssa.gov/cgi- binetcom p.cgi Here is the second line of data from the file followed by descriptions of the data. Notice that some data are ints and some are floats: 5,000.00 9,999.99 13, 848, 841 36, 423, 281 23.02549 102, 586, 913,092. 61 7,407.62 Column 0 is bottom of this income range. Column 1 is the hyphen separating the bottom of the range from the top Column 2 is the top of this income range. Column 3 is the number of individuals in the income range. Column 4 is the cumulative number of individuals in this income range and all lower ranges Column 5 is the Column 4 value represented as a cumulative percentage of all individualsStep by Step Solution
There are 3 Steps involved in it
Step: 1

Get Instant Access to Expert-Tailored Solutions
See step-by-step solutions with expert insights and AI powered tools for academic success
Step: 2

Step: 3
Ace Your Homework with AI
Get the answers you need in no time with our AI-driven, step-by-step assistance
Get Started