Question
Hi i was wondering if you could help me with a java programming exercise in BlueJ. We've been gone through the basics of java and
Hi i was wondering if you could help me with a java programming exercise in BlueJ. We've been gone through the basics of java and been briefly introduced to java.awt.Graphics class and swing.
The task is the following:
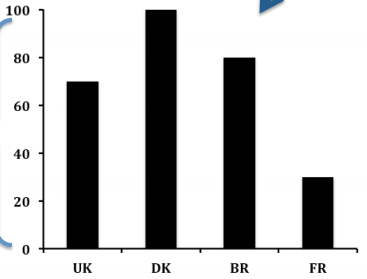
This is an exercise on GUI + Exceptions. The exercise is to implement class Histogram the constructor of which takes an array-of-numbers and an array-of- labels and is capable of visualizing them as a histogram (as shown below): The following code is intended to give rise to something along the lines of:

The histogram should normalize with maximum y-axis value (here: 100)
The histogram should plot a handful of step values (here: 0,20,40,60,80,100)
The histogram should raise appropriate exceptions wherever appropriate.
I'm having problems wrapping my head around the features the class needs to have. How do i draw the bars from the input and have the step values on the y-axis adjust accordingly. I'm guessing that i have to use the JFrame BorderLayout with a FlowLayout for the axes? Anyway i hope you can be of help and point me in the right direction :)
Kind Regards, Nikolaj
This is what i've written so far:
import java.awt.Graphics; import java.awt.Color; import javax.swing.*;
public class Histogram extends JFrame { // instance variables private int[] numbers; private String[] names; int names_amount;
/** * Constructor for objects of class HistogramDrawing */ public Histogram(int[] numbers,String[] names) { // initialise instance variables this.numbers = numbers; this.names = names; names_amount = names.length;
setTitle("Histogram"); setSize(720,480); setVisible(true); setDefaultCloseOperation(EXIT_ON_CLOSE); }
public void paint(Graphics g) { // draw the histogram //x-axis g.fillRect(20, 460, 450, 5); // y-axis g.fillRect(20, 460, 5, -400);
// Draw y-axis step values
// Draw bars using the array of numbers. for (int i = 0; i
}
}
} /** * Returns the max value of the array of numbers. Used to get the maximum step value for the y-axis. */ public int maxValue(int [] array) { int x = 0; for (int i = 0; i x ) { x = array[i]; } } return x; } public static void main(String[] args) { //Test int[] list1 = new int[] { 70, 100, 80, 30 }; String[] list2 = new String[] { "UK", "DK", "BR", "FR" };
Histogram h = new Histogram(list1,list2);
}
}
100 80 60 40 20 UK DK BR FRStep by Step Solution
There are 3 Steps involved in it
Step: 1

Get Instant Access to Expert-Tailored Solutions
See step-by-step solutions with expert insights and AI powered tools for academic success
Step: 2

Step: 3

Ace Your Homework with AI
Get the answers you need in no time with our AI-driven, step-by-step assistance
Get Started


